Download
1 / 17
170 likes | 292 Vues
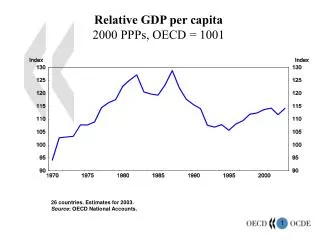
Relative GDP per capita 2000 PPPs, OECD = 1001. 26 countries. Estimates for 2003. Source : OECD National Accounts. Government consumption and investment Per cent of GDP, average 1998-2003. Effect of labour. Effect of labour. Percentage gap with respect. 1. 2. to US GDP per capita.

E N D
Relative GDP per capita2000 PPPs, OECD = 1001 26 countries. Estimates for 2003. Source: OECD National Accounts.
Government consumption and investmentPer cent of GDP, average 1998-2003
Effect of labour Effect of labour Percentage gap with respect 1 2 to US GDP per capita resource utilisation productivity Norway Norway Ireland Ireland Switzerland Switzerland Canada Canada Austria Austria Denmark Denmark Iceland Iceland Australia Australia Sweden Sweden Netherlands Netherlands France France United Kingdom United Kingdom Belgium Belgium Finland Finland Japan Japan Italy Italy 3 European Union European Union Germany Germany New Zealand New Zealand Spain Spain Korea Korea Portugal Portugal Greece Greece Czech Republic Czech Republic Hungary Hungary Slovak Republic Slovak Republic Poland Poland Mexico Mexico Turkey Turkey -80 -40 0 40 -80 -40 0 40 -80 -40 0 40 1. Labour resource utilisation is measured as total number of hours worked divided by population. 2. Labour productivity is measured as GDP per hour worked. 3. Excluding Luxembourg, The sources of real income differences, 2002 Source: OECD National Accounts of OECD Countries, 2004; OECD Labour Force Statistics, 2004 and OECD Economic Outlook, No. 76.
Agricultural support is high Producer support estimate ISL JPN EU15 USA
Labour force participation of persons aged 25-54 and 60-64 is above the OECD average for men…. Men aged 55-59 Men aged 60-64 Men aged 25-54 JPN ISL JPN ISL MEX ISL CHE JPN CHE MEX NZL MEX DNK CHE DEU NZL SWE DNK SWE KOR FRA NOR NOR NZL KOR USA CZE CZE IRL NLD GBR GBR KOR USA PRT SWE SVK CAN LUX OECD OECD SVK DEU DNK GRC NLD AUS EU-15 CAN ESP AUT ESP GRC PRT IRL TUR CAN PRT EU-15 ESP GRC NLD NOR AUS DEU OECD EU-15 FIN GBR FIN ITA ITA AUT CZE USA FRA POL IRL ITA BEL AUS FIN HUN LUX LUX AUT BEL HUN BEL HUN POL POL FRA TUR TUR SVK 0 20 40 60 80 100 0 20 40 60 80 100 0 20 40 60 80 100 Participation rates by age and gender in OECD countries, 2003
……and even more impressive for women Women aged 55-59 Women aged 60-64 Women aged 25-54 ISL ISL ISL SWE SWE SWE DNK NOR FIN NOR USA CZE FIN NZL DNK CHE KOR NOR NZL JPN SVK USA CHE CHE GBR PRT NZL CAN CAN DEU JPN OECD CAN DEU DNK GBR OECD GBR FRA FRA AUS USA PRT FIN AUT AUS IRL AUS EU-15 MEX HUN KOR GRC JPN NLD TUR PRT CZE EU-15 OECD IRL ESP EU-15 HUN DEU NLD MEX NLD POL AUT POL BEL GRC CZE KOR ESP FRA IRL POL ITA LUX GRC ITA LUX LUX HUN ITA ESP BEL BEL MEX TUR AUT TUR SVK SVK 0 20 40 60 80 100 0 20 40 60 80 100 0 20 40 60 80 100 Participation rates by age and gender in OECD countries, 2003
The components of state control and barriers to entrepreneurship, 2003
FDI restrictions in OECD countries, 1998/2000Baseline FDI restrictions
Educational attainment in OECD countries, 2002 Percentage of the population with upper secondary and tertiary education Source: OECD Education Database.
Student performance and spending per student Finland Korea Japan Netherlands Belgium Canada Switzerland Czech republic Australia Iceland Denmark Sweden Ireland Germany Austria France Slovak republic Performance in mathematics Hungary Norway Poland Spain United States Italy Portugal Greece Mexico R2 = 0.28 Cumulative Expenditure (US$)
Expenditure on R&D in OECD countries1 In per cent of GDP, 2000-03 1. Average of available data. Source: OECD Main Science and Technology Indicators.