Download
1 / 58
590 likes | 781 Vues
A Simple Parameterization For Mid-latitude Cirrus Cloud Ice Particle Size Spectra And Ice Sedimentation Rates David L. Mitchell Desert Research Institute, Reno, Nevada Brad Baker, R. Paul Lawson, Bryan Pilson and Qixu Mo SPEC, Inc., Boulder, Colorado. Motivation for Study.

E N D
A Simple Parameterization For Mid-latitude Cirrus Cloud Ice Particle Size Spectra And Ice Sedimentation Rates David L. Mitchell Desert Research Institute, Reno, Nevada Brad Baker, R. Paul Lawson, Bryan Pilson and Qixu Mo SPEC, Inc., Boulder, Colorado
Motivation for Study • CAM performance has been shown to be sensitive to the representation • of the ice particle size distribution (PSD) when the PSD is coupled with ice • sedimentation rates and cloud optical properties (Mitchell and Rasch 2006). • To drive down CAM uncertainties, the cirrus PSD should be represented in • the CAM as accurately as possible. A big advantage in using the PSD • instead of effective diameter is a realistic assessment of ice sedimentation • rates, which GCM simulations are very sensitive to. • a. In addition to the PSD, ice cloud sedimentation rates and radiative • properties depend on the ice particle area- and mass-dimension • relationships. More accurate information on these relationships would • be helpful. • Satellite retrievals of IWP are sensitive to many microphysical properties. • The above knowledge would characterize and likely reduce uncertainties • in IWP retrievals.
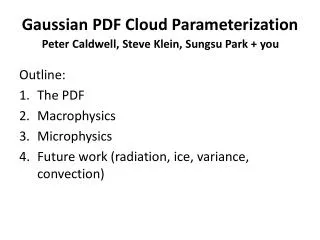
CAM Experiment Using Two PSD Schemes Small mode enhancement with decreasing T for tropical anvil cirrus; Opposite for mid-latitude cirrus. PSDs coupled with ice sedimentation and cirrus optical properties.
Impact of ice particle fall velocities IWP zonal means for in-cloud conditions, tropical & mid-latitude PSD schemes M L PSD Tropical Difference in IWP, tropical – ML PSD scheme
Impact of ice particle fall velocities – continued % difference in high-level cloud coverage, tropical – ML PSD scheme
CAM simulations for tropical anvil & synoptic cirrus PSD ML PSD Tropical LW cloud forcing SW cloud forcing
Temperature Differences: Tropical anvil minus synoptic cirrus PSD simulations
Improving the PSD Treatment for Synoptic Cirrus • PSD from Lawson et al. (2006): In situ observations of the microphysical properties of wave, cirrus and anvil clouds. Part II: Cirrus Clouds. J. of Atmos. Sci. Vol. 63, 3186-3203 Also available at: www.specinc.com/publications.htm • Mid-latitude (non-convective) cirrus PSD obtained during 22 Learjet flight missions, 104 horizontal legs (1 PSD per leg) and over 15,000 km of in-cloud sampling, -28C T -61C • Measured by: • FSSP for 2 μm < D < 30 μm*, • CPI for 30 μm < D < 200 μm*, and • 2DC for 200 μm < D < 2000 μm • * Note: Size breakpoints shown here are nominal and are adjusted slightly for best fit.
-30 < T < -34oC 60 μm Small mode Large mode N(D) = No Dν exp(-λD)
Ice Particle Mass Expressions Representative for the Large Mode PSD The diffusional growth dependence of the PSD on β can be inferred by differentiating the ice particle mass expression: m = α Dβ dD -1 1-β dm ____ = (αβ) D ____ dt dt b(β+2-σ)-1 Aggregation growth also depends on β: v = a D In practice, β is determined for the large mode by optimizing the large mode gamma-fit with the observed PSD. Note ν depends on β.
Sensitivity of large mode PSD fit to β -40 < T < -44 C -40 < T < -44 C β = 2.1 β = 1.6 (2β + 0.67)D - DZ ν = ________________________ DZ - D
Calculation of αandβ, small mode: The m-D relationship for the small mode is not too uncertain since the ice particles are quasi-spherical or compact. An m-D relationship developed by Nousiainen and McFarquhar, based on detailed mathematical analysis of small quasi-spherical CPI images, was used. Small mode IWC uncertainty ~ ± 15%. Calculation ofαandβ, large mode:β for the large mode was estimated from the PSD shape, while corresponding α values were obtained from Heymsfield et al. (2007, JAS, Refinements to Ice Particle Mass Dimensional and Terminal Velocity Relationships for Ice Clouds. Part I: Temperature Dependence). The PSD shape derived β values were generally consistent with those suggested in Heymsfield et al. (2007).
Results: Gamma function fits to observed PSD -35 < T < -39 C -40 < T < -44 C -45 < T < -49 C β = 1.6 β = 2.1 β = 1.6 -50 < T < -54 C -55 < T < -59 C -60 < T < -64 C β = 1.9 β = 2.1
Developing a PSD Scheme Diagnosed Through Temperature and IWC Strategy: Now that all the gamma parameters are known for each temperature interval, use polynomial fits to relate νandDfrom each mode to temperature. The PSD λ is determined from νandD.No for each mode is calculated from the IWC ratio; small mode to total PSD IWC. The incomplete gamma function is used to account for the change in mass relationship across the PSD when calculating No. The IWC ratio is related to temperature. Input for the PSD scheme is temperature and IWC.
Extrapolated using Ivanova et al. (2001)
large mode small mode
Testing of the PSD Scheme This scheme reproduces the time-weighted mean PSD for each 5 oC temperature interval very well, but the real test is whether it can approximate reasonably well the single leg PSD that were averaged to produce the time-weighted mean PSD. ● These single PSD were sampled over about 3-20 min., corresponding to about 30-200,000 km sampling distance. ● The sampling was done on 14 different days in different clouds.
Testing the PSD scheme at -50 to -55 oC, where single leg PSD variability was the greatest, as shown below:
Testing of the PSD Scheme (continued) The next slides compare the single measured PSD with the parameterized PSD, given by the red-dashed curve. The small mode of the measured PSD is in blue (D < 60 μm), while the large mode is in green. There are 13 comparisons. All PSD (measured and parameterized) are having the same IWC. The number concentration N and the IWC ratio (small mode to total PSD) are based on the measurements. ● Area-dimensional power laws for each mode were used to calculate Deff. These power laws yield the total measured PSD area when applied to the PSD: Aobs = ∫ γDσ N(D)dD
N = 2.34 cm-3 IWCsm/IWCt = 0.88 Samp. time = 14 min. Deff = 10 μm Predicted Deff = 13 μm 3 IWC Deff = _______ 2 ρi A
N = 0.64 cm-3 IWCsm/IWCt = 0.98 Samp. time = 3 min. Deff = 10 μm Predicted Deff = 13 μm
N = 0.21 cm-3 IWCsm/IWCt = 0.23 Samp. time = 3 min. Deff = 31 μm Predicted Deff = 13 μm
N = 0.37 cm-3 IWCsm/IWCt = 0.68 Samp. time = 14 min. Deff = 17 μm Predicted Deff = 13 μm
N = 0.56 cm-3 IWCsm/IWCt = 0.69 Samp. time = 10 min. Deff = 17 μm Predicted Deff = 13 μm
N = 1.89 cm-3 IWCsm/IWCt = 0.99 Samp. time = 12 min. Deff = 9.3 μm Predicted Deff = 13 μm
N = 0.148 cm-3 IWCsm/IWCt = 0.45 Samp. time = 10 min. Deff = 17 μm
N = 0.28 cm-3 IWCsm/IWCt = 0.96 Samp. time = 6 min. Deff = 10 μm
N = 3.65 cm-3 IWCsm/IWCt = 0.85 Samp. time = 6 min. Deff = 16 μm
N = 0.068 cm-3 IWCsm/IWCt = 0.89 Samp. time = 13 min. Deff = 10 μm
N = 0.71 cm-3 IWCsm/IWCt = 0.91 Samp. time = 4 min. Deff = 11 μm
N = 1.50 cm-3 IWCsm/IWCt = 0.78 Samp. time = 18 min. Deff = 10 μm
N = 0.33 cm-3 IWCsm/IWCt = 0.33 Samp. time = 4 min. Deff = 25 μm
Testing the PSD scheme at -35 to -40 oC, where single leg PSD variability was 2nd greatest, as shown below:
N = 1.96 cm-3 IWCsm/IWCt = 0.11 Samp. time = 9 min. Deff = 68 μm Predicted Deff = 59 μm
N = 0.50 cm-3 IWCsm/IWCt = 0.15 Samp. time = 10 min. Deff = 57 μm Predicted Deff = 60 μm
N = 3.12 cm-3 IWCsm/IWCt = 0.39 Samp. time = 5 min. Deff = 28 μm Predicted Deff = 60 μm
N = 0.91 cm-3 IWCsm/IWCt = 0.12 Samp. time = 16 min. Deff = 60 μm Predicted Deff = 59 μm
N = 0.94 cm-3 IWCsm/IWCt = 0.06 Samp. time = 20 min. Deff = 86 μm Predicted Deff = 59 μm
N = 4.47 cm-3 IWCsm/IWCt = 0.44 Samp. time = 6 min. Deff = 26 μm Predicted Deff = 60 μm
N = 0.54 cm-3 IWCsm/IWCt = 0.05 Samp. time = 19 min. Deff = 93 μm
N = 1.32 cm-3 IWCsm/IWCt = 0.34 Samp. time = 7 min. Deff = 33 μm
N = 0.65 cm-3 IWCsm/IWCt = 0.08 Samp. time = 3 min. Deff = 82 μm
N = 0.16 cm-3 IWCsm/IWCt = 0.15 Samp. time = 6 min. Deff = 52 μm
N = 0.10 cm-3 IWCsm/IWCt = 0.05 Samp. time = 3 min. Deff = 109 μm
N = 1.08 cm-3 IWCsm/IWCt = 0.06 Samp. time = 19 min. Deff = 90 μm
N = 0.96 cm-3 IWCsm/IWCt = 0.34 Samp. time = 9 min. Deff = 30 μm
Measured vs. Predicted Deff -40 < T < -35 oC: Measured Deff = 63 ± 28 μm Predicted Deff = 60 μm -55 < T < -50 oC: Measured Deff = 15 ± 7 μm Predicted Deff = 13 μm
Temperature Dependence of Deff Temperature Deff (oC) (µm) -22 33 -27 32 -32 30 -37 60 -42 22 -47 23 -52 13 -57 10 -62 10 If these Deff are representative of cirrus, what will be the sign and the magnitude of the cirrus feedback on climate? See Stephens et al. (JAS, 1990).