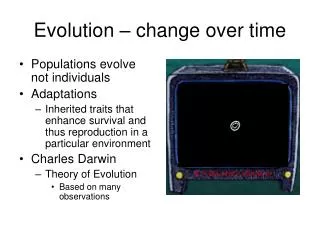
Populations change over time
Populations change over time. Changes in U.S. Bird Populations by habitat. Science News 2009. Are Populations increasing? Decreasing?. # breeding pairs. Year. Easy to tell with long term data sets. What about short term data sets?. Exponential Growth Model. Population size 2005 = 100

Populations change over time
E N D
Presentation Transcript
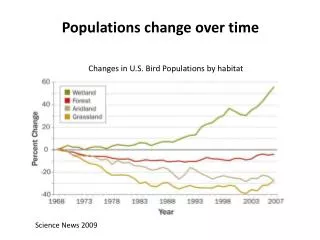
Populations change over time Changes in U.S. Bird Populations by habitat Science News 2009
Are Populations increasing? Decreasing? # breeding pairs Year
Exponential Growth Model Population size 2005 = 100 Population size 2006 = 200
Exponential Growth Model Assumption: all individuals are equal. Is this assumption is wrong???
Number of survivors (log scale) Age in relative units
Competing models Model #1 Model #2 All individuals are equal Not all individuals are equal Juvenile survival = 0.45 Adult survival = 0.9 0.33 Juveniles become adults Adults produce 13 offspring each Population size 2005 = 100 90 Juveniles, 10 adults Population size 2006 = 200 Population size 2005 = 100 Population size 2006 = 200
Population Size Year Year 2 = 200 for both
Huge difference! Population Size Year
Stage and Size predict survival and fecundity Plants- seed, seedling, adult Invertebrates- number of molts, larva-pupa-adult Fish- size predicts sex and number of eggs produced Amphibians- egg-tadpole-adult Birds- egg-chick-adult Mammals- newborn, juvenile, adult
Exponential growth model Nt=30 individuals Age-structured model Nt= newborns 20 1-year olds 8 2 2-year olds
Exponential growth model Nt=30 individuals Age-structured model 0 F1 F2 F1 F2 S0 0 0 0 1 2 0 S1 0 S1 S0
Exponential growth model Nt=30 individuals Age-structured model 0 F1 F2 20 Nt+1= S0 0 0 8 0 S1 0 2
0 S F1 F2 FM FL S0 S 0 0 S S 0 S S1 0 S S Age vs. Stage or size Models 0 1 2 S M L
S FM FL S S S S S S From Eby et al. 2005 S F
What about growth rate? R = Growth Rate, or λ (lambda) Luckily, λis an intrinsic property of the matrix 0 Only one solution For Lambda for each matrix F1 F2 20 Nt+1= S0 0 0 8 0 S1 0 2
Model output from paper There are many values, because – they varied hypoxia and effects on juvenile growth rate and calculated a lambda value for each simulation. Hypoxia No Hypoxia Natural log of lambda