Download
1 / 27
270 likes | 437 Vues
Integrated Ecological Economic Modeling of Ecosystem Services from Brazil's Amazon Rainforest. By Rosimeiry Portela At Conservation International Washington, DC July, 2005. Introduction. UC Davis.

E N D
Integrated Ecological Economic Modeling of Ecosystem Services from Brazil's Amazon Rainforest By Rosimeiry Portela At Conservation International Washington, DC July, 2005
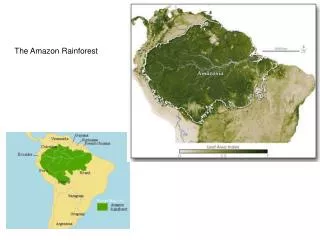
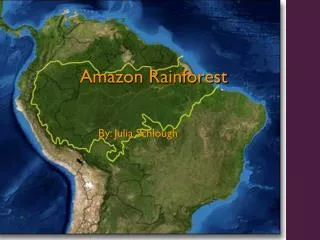
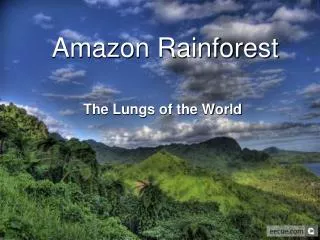
Introduction UC Davis The Amazon tropical rain forest: Largest tract of tropical forest on Earth with half of the species of the world. • Vegetation: Regional pattern of precipitation and radiation and and regulation of GHGs. • Plant animal interactions and nutrient cycling.
“To try to understand the structure and function of …(the Amazon) is comparable to composing a mosaic picture. www.redjellyfish.com www.bbcnews.com www.bbcnews.com www.bbcnews.com gustavofonseca www.bbcnews.com Sioli, H. 1984
RUMBA: Integrating functions of the ecosystem to human economy and social interactions… …with the main focus on the contribution of the ecosystem goods and functions to human economy and welfare.
RUMBA: Scenarios • Baseline: Historical trends; • Scenario 1: Increased investment in BC with region’s own financial resources; • Scenario 2: Increased investment in BC with region’s and external financial resources; • Scenario 3: Increased investment in NC with region’s own financial resources; • Scenario 4: Increased investment in NC with region’s and external financial resources. www.bbcnews.com www.bbcnews.com
Research Results: Annual Deforestation RatesBaseline and Alternative Scenarios
Research Results: Annual Deforestation Rates Year 2050 • Scenario 1: 27 thousand km2 yr-1 • Scenario 2: 29 thousand km2yr-1 • Scenario 3: 22 thousand km2yr-1 • Scenario 4: 25 thousand km2yr-1 Forest is cleared at a faster rate under scenarios of increased development. 2050: Baseline: 26 thousand km2 yr-1
Research Results: Annual Deforestation Rates Deforested areas under scenarios of increased development are higher than those of conservation and Baseline Deforestation in Scenario in Relation Baseline (2100) • Scenario 1: -73 thousand km2 • Scenario 2: -171 thousand km2 • Scenario 3: +205 thousand km2 • Scenario 4: +45 thousand km2
Research Results: Land Cover/Land Use Composition Baseline Scenario Strong trend in land conversion from forest to other land uses; • 1975: 96% forest cover • 2100: 26% forest cover Land Use • Pasture: 40% • Fallow: 24% • Agriculture: 10%
Results: Climate Variables/Baseline Scenario • Precipitation: 23% reduction • Evapotranspiration: 26%reduction • Temperature: 11% increase • Forest Carbon Balance: Decreasing Uptake and Increasing Emissions www.Redjellyfish.com
Results: Ecosystem Services Variables • Removal of forest cover leads to increasing losses of ecosystem services: +70% by 2100 • Higher losses observed in scenarios of increased development • Monetary valuation: Increasing prices per unit of service www.greenpeace.com
Results: Average Values of Ecosystem Services www.greenpeace.com
Results: Monetary Valuation of Ecosystem Services Value of ecosystem services is estimated at about 5 times the GRP
Results: Capital Variables/Baseline Scenario www.greenpeace.com POPULATION GROWTH (1E6 People) 1975 2100 BASELINE 11.0 61.2 SCENARIO 1 66.3 SCENARIO 2 67.9 SCENARIO 3 55.1 SCENARIO 4 57.4
Results: Compensation for Avoided Deforestation www.junglephotos.com Gains to the regional economy from forest conversion against losses associated with emissions Scenario 3 (2005-2091) • Forest spared from deforestation : 210 thousand km2 • Avoided Emissions: 3.0 Pg C • Foregone economic growth: US$ 1.7 Trillion • Amazon Deforestation: 0.3 Pg C yr-1 • Kyoto Target: 0.5 Pg C yr-1
Discussion: Main Findings • Increasing land use change in the Brazilian Amazon incurs significant losses without this being adequately offset by increasing monetary income or welfare of people of the region. www.nasa.com • In the absence of significant incentives from global beneficiaries for any one ecosystem service or a combination of incentives addressing several ecosystem services, rational uses at the local level lead to sub optimal uses from the global perspective.
Discussion: Alternatives • Effective Comand and Control Regulations • Efficient Market-Based Instruments: • Carbon-offsetting trading • Conservation Concession • Timber Certification • Fair Trade • Secure Property Rights • Tradeable Development Rights • International Grants Resources • Global Forestry Agreements www.junglephotos.com
Overall Conclusions • Deforestation proceeds at high rates in the Brazilian Amazon • The region suffers significant climate changes and losses of forest services as a result of forest removal • Increasing regional economic growth is not translated into increasing monetary income and welfare • Protection of forest will require a concerted long-term effort www.junglephotos.com
Model Limitations and Caveats RUMBA: A unified metamodel • Use of average parameters; • Assumptions to model processes that are poorly understood; • Linearly homogeneous production functions; • Sensitivity of production limits of biosphere to climate variables; • Sensitivity of economic production to climate variables and decreasing stocks of natural capital; • A economic distribution function. www.bbc.com
‘What we are doing to the forest of the world is but a mirror reflection of what we are doing to ourselves and one another’. —Mahatma Ghandi www.freejunglephotos.com