Download
1 / 40
400 likes | 511 Vues

E N D
Snowmelt Runoff, The Fourth Paradigm, and the End of StationarityHow can we protect ecosystems and better manage and predict water availability and quality for future generations, given changes to the water cycle caused by human activities and climate trends?In what ways can feasible improvements in our knowledge about the mountain snowpack lead to beneficial decisions about the management of water, for both human uses and to restore ecosystem services?Jeff Dozier, University of California, Santa Barbara
Snow-pillow data for Leavitt Lake, 2929 m, Walker R drainage, applies to Tuolumne & Stanislaus
Snow-pillow data for Gin Flat, 2149 m, Tuolumne R drainage, applies to Merced R
The Fourth Paradigm • An “exaflood” of observational data requires a new generation of scientific computing tools to manage, visualize and analyze them. http://research.microsoft.com/en-us/collaboration/fourthparadigm/
Along with The Fourth Paradigm, an emerging science of environmental applications • Thousand years ago —experimental science • Description of natural phenomena • Last few hundred years —theoretical science • Newton’s Laws, Maxwell’s Equations . . . • Last few decades — computational science • Simulation of complex phenomena • Today — data-intensive science (from Tony Hey) • 1800s → ~1990 — discipline oriented • geology, atmospheric science, ecology, etc. • 1980s → present — Earth System Science • interacting elements of a single complex system (Bretherton) • large scales, data intensive • Emerging today — knowledge created to target practical decisions and actions • e.g. climate change • large scales, data intensive
The water cycle and applications science • Need driven vs curiosity driven • How will we protect ecosystems and better manage and predict water availability and quality for future generations? • Externally constrained • e.g., in the eastern U.S., the wastewater management systems were built about 100 yrs ago with a 100-year design life • Useful even when incomplete • The end of stationarity means that continuing with our current procedures will lead to worsening performance (not just continuing bad performance) • Consequential and recursive • Shifting agricultural production to corn-for-ethanol stresses water resources • Scalable • At a plot scale, we understand the relationship between the carbon cycle and the water cycle, but at the continental scale . . . • Robust • Difficult to express caveats to the decision maker • Data intensive • Date volumes themselves are manageable, but the number and complexity of datasets are harder to manage
Steven ChuNobel LaureateUS Secretary of Energy “We seek solutions. We don't seek—dare I say this?—just scientific papers anymore”
Manual measurement of SWE (snow water equivalent), started in the Sierra Nevada in 1910
Sierra Nevada, trends in 220 long-term snow courses (> 50 years, continuing to present)
Example forecast, April 2010 • American River below Folsom Lake, April-July unimpaired runoff (units are 1,000 acre-ft)
We manage water poorly . . . • We do not predict and manage water and its constituents well • Despite large investments, we suffer from droughts, floods, stormwater, erosion, harmful algal blooms, hypoxia, and pathogens with little warning or prevention • Current empirical methods were developed over a period when human impacts were isolated and climate trends slower • Drivers are climate change, population growth and sprawl, land use modification • Milly et al., Science 2008: Stationarity is dead: whither water management? • We need to better understand how/when to adapt, mitigate, solve, and predict • More physically based, less empirical, methods are needed
Integrating across water environments: How to make the integral greater than the sum of the parts?
Forecasting Reporting Analysis Done poorly Integration Data >>> Information >>> Insight >>> Increasing value >>> Distribution Done poorly to moderately Aggregation Quality assurance Sometimes done well, by many groups,butcould be vastly improved Collation Monitoring The water information value ladder Slide Courtesy CSIRO, BOM, WMO
Collect Store Present Analyze Search Retrieve The data cycle perspective, from creation to curation • The science information user: • I want reliable, timely, usable science information products • Accessibility • Accountability • The funding agencies and the science community: • We want data from a network of authors • Scalability • The science information author: • I want to help users (and build my citation index) • Transparency • Ability to easily customize and publish data products using research algorithms • The Data Cycle
Organizing the data cycle • Progressive “levels” of data • (Earth Observing System) • Raw: responses directly from instruments, surveys • Processed to minimal level of geophysical, engineering, social information for users • Organized geospatially, corrected for artifacts and noise • Interpolated across time and space • Synthesized from several sources into new data products • System for validation and peer review • To have confidence in information, users want a chain of validation • Keep track of provenance of information • Document theoretical or empirical basis of the algorithm that produces the information • Availability • Each dataset, each version has a persistent, citable DOI (digital object identifier)
Example data product: fractional snow-covered area, Sierra Nevada
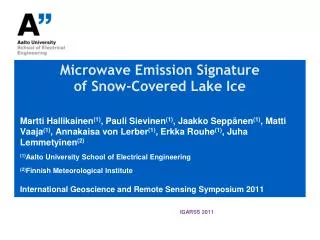
Spectra with 7 MODIS “land” bands (500m resolution, global daily coverage)
Snow/cloud discrimination with Landsat Bands 3 2 1 (red, green, blue) Bands 5 4 2
100% Snow 100% Vegetation 100% Rock/Soil Pure endmembers,01 Apr 2005 MODIS image
Example of satellite data management issue: blurring caused by off-nadir view
Daily MODIS acquisition, processing for Sierra Nevada snow cover and albedo
Snow-covered area and albedo, 2004 Snow Covered Area Albedo
American River basin Snow pillows, 2005
Regional models: better results for temperature than for precipitation Precipitation: mean of 15 models (red) vs observations (green) Temperature: mean of 15 models (red) vs observations and reanalyses Vertical bars are ±1 standard deviation of model monthly results Coquard et al., 2004, Climate Dynamics
Model uncertainty in precipitation change Change in precipitation under 2xCO2 for western US: Average and standard deviation of 15 different climate models Coquard et al., 2004, Climate Dynamics
Real uncertainties in climate science • Regional climate prediction • Adaptation is local • Problems w downscaling, especially in mountains • Precipitation • Especially winter precipitation • Aerosols • Lack of data • Interactions with precipitation • Paleoclimate data • E.g., tree-ring divergence • “This climate of • suspicion we’re • working in is insane. • It’s drowning our • ability to soberly • communicate gaps in • our science.” • Gavin Schmidt Schiermeier, 2010, Nature
“The right lessons for the future of climate science come from the failure to predict earthquakes” • Daniel Sarewitz Limits of predictability • As scientists, we are attracted to thechallenge of making predictions • And decision makers would like to pass the blame when we’re wrong • Don’t confuse the distinct tasks of bringing a problem to public attention and figuring out how to address the societal conditions that determine the consequences • If wise decisions depended on accurate predictions, then few wise decisions would be possible • Instead of predicting the long-term future of the climate, focus instead on the many opportunities for reducing present vulnerabilities to a broad range of today's — and tomorrow's — climate impacts
Availability of data • We have done 2000-2009 for whole Sierra Nevada, 2010 ongoing • We want users (dozier@bren.ucsb.edu) • Need information about typical formats and extents that users want