Download
1 / 10
110 likes | 260 Vues
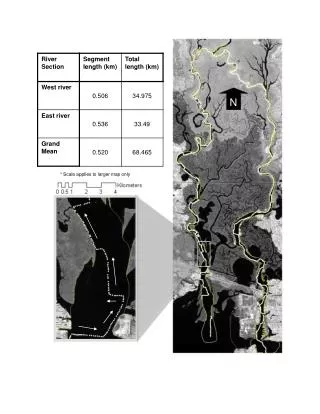
N. * Scale applies to larger map only. Geo-rectified infrared image with three color bands (R,G,B). Unsupervised classification using the Maximum likelihood algorithm. Original classified image with 32 classes.

E N D
N * Scale applies to larger map only
Geo-rectified infrared image with three color bands (R,G,B) Unsupervised classification using the Maximum likelihoodalgorithm Original classified image with 32 classes Figure Y: Conceptual schematic of the unsupervised classification methods used on the basemap Final classified image
. . . . . Classification Classification Classification Classification Classification Color Color Color Color Color River River River River River Forest Forest Forest Forest Forest Anthropogenic structures Anthropogenic structures Anthropogenic structures Anthropogenic structures Anthropogenic structures Low marsh Low marsh Low marsh Low marsh Low marsh High marsh High marsh High marsh High marsh High marsh Primary Growth Zones Primary Growth Zones Primary Growth Zones Primary Growth Zones Primary Growth Zones Figure 3: Unsupervised classification of land-use/ land cover in the lower Pascagoula River, MS.
River mouth River fork Salinity (‰) Horizontal profile Salinity (‰) Figure Z: Horizontal profile interpolation of salinity collected in December 2003.
(‰) Figure 7: Interpolated horizontal profiles and descriptive statistics of salinity (‰) collected during March 2003 from the east and west distributaries of the Pascagoula River, MS.
(‰) Figure 8: Interpolated horizontal profiles and descriptive statistics of salinity (‰) collected during May 2003 from the east and west distributaries of the Pascagoula River, MS
(‰) Figure 9: Interpolated horizontal profiles and descriptive statistics of salinity (‰) collected during July 2003 from the east and west distributaries of the Pascagoula River, MS.
Figure 10: Interpolated horizontal profiles and descriptive statistics of temperature (°C) collected during March 2003 from the east and west distributaries of the Pascagoula River, MS. (°C)
Figure 11: Interpolated horizontal profiles and descriptive statistic of temperature (°C) collected during May 2003 from the east and west distributaries of the Pascagoula River, MS (°C)
(°C) Figure 12: Interpolated horizontal profiles and descriptive statistics of temperature (°C) collected during July 2003 from the east and west distributaries of the Pascagoula River, MS.