Map Scale
Map Scale. Sizing the Model May 17, 2013. Map Scale. Ratio of a single unit of distance on map to the corresponding distance measured on the surface of the ground Gives idea of area covered Example: If Map scale = 1:24,000 Then 1 unit of measurement on map represents the

Map Scale
E N D
Presentation Transcript
Map Scale Sizing the Model May 17, 2013
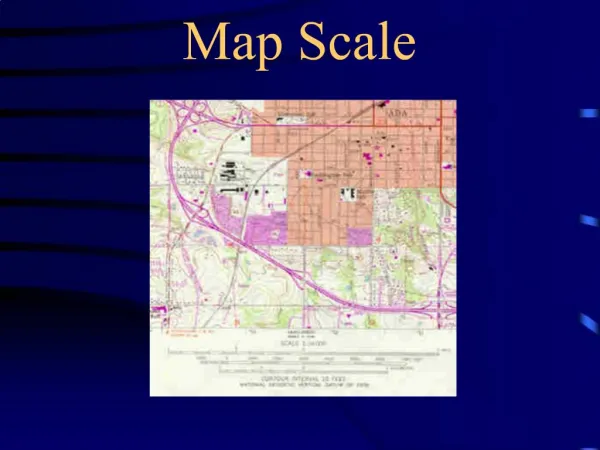
Map Scale • Ratio of a single unit of distance on map to the corresponding distance measured on the surface of the ground • Gives idea of area covered • Example: If Map scale = 1:24,000 Then 1 unit of measurement on map represents the 24,000 of the same units on the surface of ground
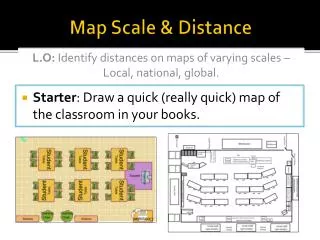
Scale • Three types of scale depictions: • Verbal: One Inch equals One Mile • Numeric Ratio: 1:24,000, Fractional: 1/24,000 • Graphic
Map Scale • How to Calculate Corresponding Distance on Ground Example: Map Scale = 1:200,000 Given Map distance = 3 cm Required x = Equivalent distance on ground The above scale defines that 1 cm on map = 200,000 cm on ground 1/200,000 = 3/x x = 600,000 cm or 6 Km on ground
Quiz Question: Map Scale = 1:24,000 400 ft on ground = ________inch on map?
Large Scale vs. Small Scale • Refer to scale shown as a fraction • Large means small denominator and small means larger denominator • Q: which map has a larger scale – 1:1000 OR 1:25,000? • Why larger? – shows the features at a larger and more detailed size
Large Scale Map • In larger scaled maps more details but less area covered (for a fix size) • Relatively small portion is covered with higher local detail • Usually maps that are 1:24,000 or larger are considered large scale** ** http://www.esri.com/industries/k-12/PDFs/intrcart.pdf
Small Scale Map • Relatively large area of Earth is covered • In a smaller scaled map certain features might be omitted • Detail at global level with limited local detail • Usually maps 1:250,000 or smaller are considered small scale** • Any map with scale between large and small scale is intermediate scale maps ** http://www.esri.com/industries/k-12/PDFs/intrcart.pdf
Large Scale Scale 1: 3,000
Small Scale Scale 1: 1000000
Medium Scale Scale 1: 200,000
Large Scale vs. Small Scale Reference:
Map Scale • Selection of a scale depends on its intended use • Select a scale which is convenient to handle • Scale will change appropriately as paper scale changes
Map Designing Optimal Representation of Spatial Information
Mapping Prerequisites Keep the following points in mind before designing a Map • Purpose of the map (remember the message) • Context of the map • Potential users • Available resources (data and tools) • Important features which need to be highlighted and less important in the background (not prominent) • Design elements needed to properly communicate the message • Format of the final project
Map Designing • Map Designing Steps • Determine the objectives of the map • Decide on the data layers to be included • Plan a layout • Select only the area of interest • Choose colors and symbols • Map should also look good in black and white • 1 out of 10 people are color blind • Printing in black and white • Use low saturation colors in background • Create the map
Selection of Layers • Most important layers = clearest and largest symbols! • Some ancillary layers help reader to orient themselves • Too many ancillary layers can drown out your message • Make the representation of some ancillary layers less prominent Use: • smaller symbols • smaller text • transparency, etc.
Typography (Labeling) • Simple and brief but accurate • Make sure text is legible • Placement should least obscure underlying information • Font size hierarchy to indicate relative importance • Use no more than four fonts or text sizes on a map • Label outside area only if the purpose is to show the orientation of the study area
Legibility of Text • Typeface • Easy and clear to read • Size • Readable size • Color • Sufficient contrast between background and letters • Line Length • Longer lines are difficult to read • Leading (space between two lines) • Legibility may be increased by increasing the leading between rows of text
Legibility (readability) of Text Source: http://www.kristinlong.com/Typography.pdf
Traditionally plain font for land and italic font for water features Label spread out along the feature Several labeling styles available Typography (Conti..)
Typography (Labeling) Scale 1: 200,000 Scale 1: 10,000
Bad Maps • Poor symbols, poor color, poor design, hard to read, poor legends
Map Types 1. Planimetric (e.g municipal base map) A map designed to portray the horizontal positions of features; vertical information is specifically ignored. 2. Topographic (e.g. USGS 7.5 minute quads) A map designed to portray features on the surface of the Earth, including relief (elevation), hydrography, and cultural features 3. Cadastral (e.g municipal parcel map) A map representing boundaries of land parcels, ownership, land use, valuation, and other related information. 4. Image (e.g LANDSAT image ‘map’) A map representing a remotely sensed picture or reflection of all or part of the Earth's surface 5. Thematic • A map used to visualize spatial relationships and patterns among information pertaining to some theme or concept Reference: Ron Brigg UT Dallas
Representation of Thematic Maps • Choropleth map: uses zones or polygons to display information using shading, dot, density, or other techniques. • e.g population change, ethnicity distribution • Proximal (dasymetric) map: shows zones of constant attributes, such as soil type or vegetation (similar to choropleth except that data determines boundary lines; no pre-defined polygons) • e.g. zoning, soil map • Isopleth map (contour or isarithmic): shows a continuous three dimensional surface such as elevation using lines connecting points of equal value (contours). • e.g elevation, travel time contours from a point(s), land values, income • Point (dot) or symbol map: shows information relating to specific points using marker symbols whose size and/or frequency relates to magnitude of phenomena • housing sales, code violations, crimes Reference: Ron Brigg UT Dallas
Other Thematic Maps • Single symbol maps • Single symbol used for all features • Unique value maps • Different symbols or colors for each category or value
Which Map Suites to What Data Types? • Nominal data_________ Single symbol maps • Categorical data_______ Unique values map • Ordinal data __________ Unique values map • Interval and Ratio data__ Quantities map (graduated color, graduated symbol, dot density)
DataClassification It is a key method of abstracting reality into simplified map Method of classification effects the ‘look’ of the map Classification should match data distribution Distribution of zones into classes Max of 6 number of classes recommended (such that reader can interpret between them)
ClassificationOptions • Natural Breaks • Quantiles • Equal Interval • Standard Deviation
References • http://www.kristinlong.com/Typography.pdf • http://www.state.nj.us/dep/gis/training/scaleaccurlayout.ppt • Introduction to Geographical Sciences, Training Lectures and Presentations Prepared by National Center for Remote Sensing and Geoinformatics (NCRG) Karachi (undated) • GIS Cartography: A Guide to Effective Map Design by Gretchen N. Peterson, 2009