Download
1 / 47
470 likes | 713 Vues
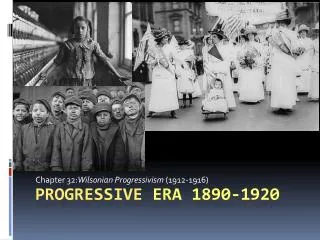
First Restriction Era 1875-1920. Restriction of “undesirables” Chinese Exclusion Act. 1892 Gentleman’s Agreement with Japan Dillingham Commission 1907 Asiatic Barred Zone. 1882. Chinese Exclusion Act Restricts all Chinese laborers Bars Chinese naturalization Immigration Act of 1882

E N D
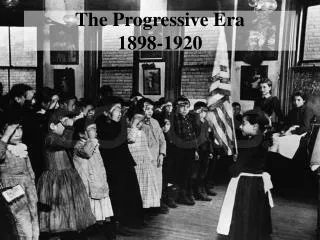
First Restriction Era 1875-1920 • Restriction of “undesirables” • Chinese Exclusion Act. 1892 • Gentleman’s Agreement with Japan • Dillingham Commission 1907 • Asiatic Barred Zone
1882 • Chinese Exclusion Act • Restricts all Chinese laborers • Bars Chinese naturalization • Immigration Act of 1882 • Specifically made regulation of immigration the duty of the Federal Government (Treasury) • Barred those likely to become public charges
1891 • Restricted polygamists, crimes involving moral turpitude • Those suffering a loathsome or contagious disease • (cholera, TB) 1903: added epileptics
Dillingham Commission • 1907-1911 • 42 Volumes • Recommended restriction of immigration. • Contained a great deal of debate and testimony about the “racial” inferiority of immigrants from Southern, Central, and Eastern Europe
Immigration Act of 1917 • Instituted Literacy Requirement • Created “Asiatic Barred Zone”. Barred all immigration from Asia. • Expanded powers of immigration officers to exclude or deport people. • Public Health Service to do screening for diseases.
Second Restriction Era 1921-1964 • National Origins Act of 1924 (Johnson Reed Act) • Total of 154,000 immigrants per year. • Western Hemisphere not restricted.
1924 Johnson Reed Act P83% of immigrants were to come from North and West Europe P 15% were to come from Southern and Eastern Europe P2% were to come from the rest of the world PBarred all people who were ineligible for citizenship. Asiatic Barred Zone
1924 Johnson Reed Act • Limited immigration from the Eastern Hemisphere to 154,000 per year. • Used 1890 Census Figures to determine national origins quotas. • Created visas, and screening by consuls abroad. • Created Border Patrol • Did not limit the Western Hemisphere
Controlling Immigration • INS created in 1924 • In Labor Department until 1942 • Laws limiting public charges • Depression: 400,000 Mexicans--”Voluntary Repatriation” 50% of deportees were born in US and thus citizens.
Mexicans and Immigration Restriction • Dillingham Commission heard a lot of racist testimony about Mexicans and Southern Central and Eastern Europeans. • Congressman testified: • Illiterate, unclean peonized masses…a mixture of Mediterranean blooded Spanish peasants with low grade Indians who did not fight extinction but submitted and multiplied as serfs. The influx of Mexicans creates the most insidious and general mixture of white, Indian and Negro blood strains ever produced in America.
Immigration from Mexico • 1848 Treaty of Guadelupe Hidalgo ended the Mexican American War. • United States annexed CA, AZ, NM, CO, TX • 1910-1917 Mexican Revolution and economic development created push factor in Mexico. • Border 2000 miles long. History of back and forth movement.
Bracero Program • 1942-1964 FARM Labor • US underwrote travel costs • Guaranteed just and equitable treatment • 5 million people came. Meant to be temporary. Many stayed.
1965 Law Hart-Celler Act • Replaced Quotas with Uniform Limit Per Country. Preference System • Limited Western Hemisphere for first time • Came along with Civil Rights Legislation. Introduced by Kennedy. Passed under Johnson. • Principles: Family Reunification. Employment. Refugees. • Unintended Consequences. Asian and Latin American immigration.
Intended Consequences • Law was intended to end racial discrimination: • Lyndon Johnson: • This system violates the basic principle of American democracy—the principle that values and rewards each man on the basis of his merit as a man. It has been un-American in the highest sense, because it has been untrue to the faith that brought thousands to these shores even before we were a country. 1965
Unintended Consequences • Lawmakers argued it would not increase numbers of immigrants or the ethnic mix. • Attorney General Robert Kennedy: • I would say for the Asia Pacific Triangle it immigration would be approximately 5,000 Mr.Chairman, after which immigration from that source would virtually disappear; 5,000 immigrants would come the first year, but we do not expect that there would be any great influx after that.
Unintended Consequences • Rep. Emanuel Celler • Immigrants from Asia and Africa will have to compete and qualify in order to get in, quantitatively and qualitatively, which, itself will hold the numbers down. There will not be, comparatively, many Asians or Africans entering this country. Since the people of Africa and Asia have very few relatives here, comparatively few could immigrate from those countries because they have no family ties in the US. • August 25, 1965.
Unintended Consequences • Senator Edward Kennedy: • The bill will not flood our cities with immigrants. It will not upset the ethnic mix of our society. It will not relax the standards of admission. It will not cause American workers to lose their jobs. Feb 10, 1965.
Legacies of the Law • Created three categories of people • Immigrants (Family/Employment) • Refugees/Asylees • Illegal/Undocumented Immigrants • Family Chain Migration is Unlimited.
Refugees • 1951 International Law on Refugees • Someone with a well founded fear of persecution based on race, religion, national origin, political opinion or membership in a particular social group. • US ratified that law in 1968. 1980 Refugee Act adopted that international definition as our own. • Refugees get government assistance. Program of resettlement. Legal status.
2011 Refugees • 56,384 refugees • Burma (30%) • Bhutan (27%) • Iraq (17%) • Somalia (6%) • Cuba (5%) • Eritrea (4%) • Iran (4%)
Refugees • Number set each year according to State Department and world conditions • 1970’s 1980’s some years over 200,000 • 1990’s 2000’s less, peak year 1992 it was 142,000 • 2000 to 2007 cap was 70,000
Asylees • 24,988 in 2011 • China (29%) • Venezuela (7%) • Haiti (6%) • Egypt (6%) • Ethiopia (4%)
Current Immigration • Worldwide cap of 675,000 visas per year. • 480,000 for family reunification • 140,000 for employment • 55,000 for diversity • 120,000 for refugees (outside cap) • Per country ceiling of 25,600 visas includes family and non family immigrants. (But immediate family is not included in the numbers adding to the ceiling.).
2009 Statistics • 1,130,818 legal immigrants • Estimate: 500,000 undocumented • 33.7 million non immigrant arrivals
There are 37,547,789 foreign born people in the US. Estimated that 11.3 million are undocumented. (32%) National Polls: 70% of Americans believe most immigrants are illegal. Percent Illegal
2006 Immediate Family 46% Extended Family 17% Employment 13% Diversity 3% Refugees 17% Immigration Categories
1-Mexico 2-China 3-Philippines 4-India 5-Cuba 6-Colombia 7-Dominican Republic 8-El Salvador 9-Vietnam 10-Jamaica Top Source Countries, 2006
Current Preference System • FIRST: Priority Workers. Outstanding ability. Managers. Professors. Multinational Executives 40,000 • SECOND: Professions holding advanced degrees. 40,000 • THIRD: Skilled labor (two years training) 40,000. (5,000 can go to unskilled) • FOURTH: Special immigrants, including ministers. (10,000) • FIFTH: Investors 500,000 to 3 million to invest. Employ 10 workers (10,000)
Non immigrant workers • A visas diplomatic employees • D visas air and sea crew members • E visas treaty investors • N visas Internationally recognized athletes and entertainers • H visas specialty occupations • J visas students and professors
2006 • 1, 266,264 people got Legal Permanent Residence (LPR). • (In 2000 it was 841,002) • 45.8% were immediate relative of US citizen. • 17.5 % came through a family sponsored preference • 12.6 % came through an employment preference • 17.1% were refugees or asylees • 3.5 % won the diversity lottery
2006 Origins of LPRs • Mexico 13.7 % • China • Phillippines • India • Cuba • Colombia • Dominican Republic • El Salvador • Vietnam • Jamaica • Together these ten countries account for 50%
2006 Non Immigrant Admissions • 33.7 million (not counting Mexicans and Canadians with border cards) • Number of arrivals, not persons. • Temporary admissions 29.9 million (89%) • 24.8 million tourists • 5 million business • Temporary workers and trainees (incl. spouses and children • 1, 709, 953 (5% of total) • Students and their families • 1,168,020 (3.5%)
Other Nonimmigrant Admissions Source: bcs.e.8
Foreign-Student Arrivals Number < Source: bcs.e.7.4
Why Do Americans Care About Undocumented Immigrants? • Why do some Americans feel so strongly about undocumented immigrants?
U.S. Undocumented Immigrants • Before 1965 it was not really an issue. • 1974 “Discovery” of 4-12 million. • Delphi Method: 8 million. • Apprehensions as main source of data. • 1986 IRCA Law • 1.75 million people working since 1982 • special agricultural workers 1.27 million
Undocumented Immigrants • IRCA legalized 2.7 million people • Illegal immigration current estimate 11 million people. • Annual inflow 500,000 per year. • 60% cross the border • 40% overstay their visa • After entering country, 1-2% chance of being caught.
Unauthorized Population • Estimated at 11.3 million. • Mexico (57%) • El Salvador (4%) • Guatemala (4%) • Philippines (2%) • Honduras (2%)
Unauthorized Population • Growth in population 2000-2006 • India (125%) • Brazil (110%) • Honduras (75%)
Citizenship in the U.S. • By birth (even if parents are illegal, or here for a short period of time) • By birth abroad if parents are citizens • By adoption • By naturalization if they comply with conditions specified by law