GEOS5/MERRA Precipitation Evaluation
30 likes | 169 Vues
GEOS5/MERRA Precipitation Evaluation. GEOS5 in the figures refers to a pre-production version of the 1/2° MERRA reanalysis system

GEOS5/MERRA Precipitation Evaluation
E N D
Presentation Transcript
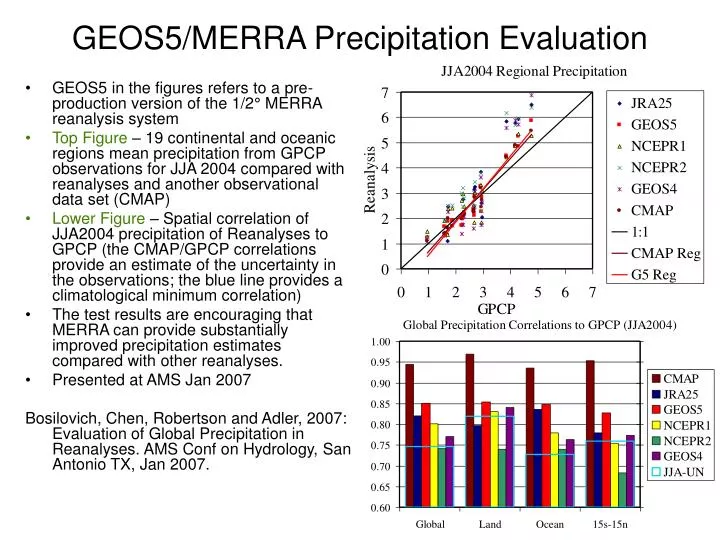
GEOS5/MERRA Precipitation Evaluation • GEOS5 in the figures refers to a pre-production version of the 1/2° MERRA reanalysis system • Top Figure – 19 continental and oceanic regions mean precipitation from GPCP observations for JJA 2004 compared with reanalyses and another observational data set (CMAP) • Lower Figure – Spatial correlation of JJA2004 precipitation of Reanalyses to GPCP (the CMAP/GPCP correlations provide an estimate of the uncertainty in the observations; the blue line provides a climatological minimum correlation) • The test results are encouraging that MERRA can provide substantially improved precipitation estimates compared with other reanalyses. • Presented at AMS Jan 2007 Bosilovich, Chen, Robertson and Adler, 2007: Evaluation of Global Precipitation in Reanalyses. AMS Conf on Hydrology, San Antonio TX, Jan 2007.
Further Comments on the slide not to be put up on the projector • The top figure is JJA 2004 P means for 19 regions (See fig 14 in preprint) scattered against GPCP. The red line is the linear regression of the GEOS5-GPCP data (GPCP and CMAP fits are close together). The brown line is the regression of GPCP-CMAP merged observation data sets, showing their uncertainty. • The bottom figure shows the spatial correlation of the reanalyses and CMAP against GPCP monthly mean for the globe, global land, global oceans and the tropics. The brown bar shows the upper limit of spatial correlation given the uncertainties in GPCP and CMAP. The blue line show the minimum correlation with climatological skill (in the preprint, see the discussion on “Unmatched Correlations”). I have also done this calculation for all of the 19 regions mentioned previously, and GEOS5 is at or near the highest spatial correlation in 18 (Africa shows lower correlations) compared to all the reanalyses. • I see this as an extremely positive result for GEOS5 relative to the existing reanalyses, and the data it can provide for NEWS. However, while this experiment was run with the G5 ½ degree configuration, it was GEOS5 Beta9. Several science changes and bug fixes have been implemented since. There is an experiment with the latest GEOS5 Beta10 for MERRA going now, for which we will redo this.