BioDCV: a grid-enabled complete validation setup for functional profiling
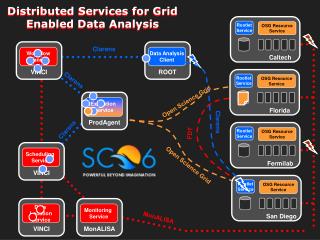
BioDCV: a grid-enabled complete validation setup for functional profiling. S. Paoli , D. Albanese, G. Jurman, A. Barla, S. Merler, R. Flor, S. Cozzini, J. Reid, C. Furlanello. EGEE User Forum CERN, 01-03.03.2006. http://mpa.itc.it. Summary.


BioDCV: a grid-enabled complete validation setup for functional profiling
E N D
Presentation Transcript
BioDCV: a grid-enabled complete validation setup for functional profiling S. Paoli, D. Albanese, G. Jurman, A. Barla, S. Merler, R. Flor, S. Cozzini, J. Reid, C. Furlanello EGEE User Forum CERN, 01-03.03.2006 http://mpa.itc.it
Summary Predictive profiling from microarray data. A complete validation environment in grid: BioDCV. Test: Cluster vs Grid. EGEE User Forum, CERN, 01-03.03.2006
Predictive Profiling Over-expressionin group B Over-expressionin group A Group A A B B samples Under-expressionin group B genes Array(gene expression Affy) A PANEL OF DISCRIMINATING GENES? Group B QUESTIONS for a discriminating molecular signature: • predict disease state • identify patterns regarding subclasses of patients EGEE User Forum, CERN, 01-03.03.2006
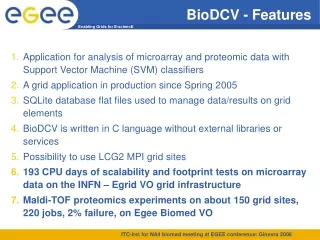
The BioDCV system A software setup for predictive molecular profiling gene expression data: • A set-up based on theE-RFE algorithm for Support Vector Machines (SVM). • Control of selection bias, outlier detection • Subtype identification • C language coupled with SQLite database libraries. • It implements complete validation procedureon distributed systems: MPI or Open Mosix clusters. • Since March 2005: ported as grid application with MPI execution through LCG middleware and data storage in SE. EGEE User Forum, CERN, 01-03.03.2006
The BioDCV setup (E-RFE SVM) • To avoid selection bias (p>>n): a COMPLETE VALIDATION SCHEME* • externally a stratified random partitioning, • internally a model selection based on a K-fold cross-validation • 3 x 10⁵ SVM models (+ random labels 2 x 10⁶)** B=400 * Ambroise & McLachlan, 2002, Simon et. al 2003, Furlanello et. al 2003 OFS-M: Model tuning and Feature ranking ** Binary classification, on a 20000 genes x 45 cDNA array, 400 runs ONF: Optimal gene panel estimator ATE: Average Test Error EGEE User Forum, CERN, 01-03.03.2006
Implementation BioDCV system 2-50 MB 50-400 MB SE WN WNs CE SE UI Egrid Egrid infrastructure EGEE User Forum, CERN, 01-03.03.2006
Experiments We present two experiments designed to measure the performances of the BioDCV. • Resources A Linux cluster of 8 Xeon CPUs 3.0 GHZ and Egrid infrastructure (into Italian Grid-it) ranging from 1 to 64 Xeon CPUs 3.0 GHZ. • Data A set of 6 different microarray datasets. • Tests • Benchmark 1: footprint • Benchmark 2: scalability EGEE User Forum, CERN, 01-03.03.2006
Datasets Footprint (dN=Samples x Genes) 1-2 IFOM-INT, Milan (Italy), 2005 3 ATAC-PCR: Sese et. al, Bioinformatics 2000 3 Yeoh et al., NCBI 2002 4 Wang et al., Lancet 2005 5 Chang et al., PNAS 2005 Benchmark1 Benchmark2 EGEE User Forum, CERN, 01-03.03.2006
Benchmark 1 • We characterize the BioDCV application with respect to different dataset for fixed number of CPUs in grid. • This benchmark tries to discover the discrimination factor, called footprint, between execution times of one application and its input data • Applied on the set of 6 microarray datasets with a fixed number of 32 CPUs in grid. S: semisupervised analysis time T_tns: effective execution time, total execution time (without time spent in queue) Li: experiment setup Evaluation metrics: T_tns=Li+U+E_g+D+S D: time for data retrieval and download. This includes copying all results from the WNs to the starting SE, and their transfer to local site U: time for uploading data and application to the grid, including delivery on CE. E_g: computing time without latency time EGEE User Forum, CERN, 01-03.03.2006
BRCA PL Wang Chang Morishita Sarcoma T_tns E_g 100000 Time (s) 50000 10 x S 10 x L_i 10000 10 x U 1500 1 2 3 4 5 6 7 8 dN / 106 Benchmark 1 - Footprint Dataset footprint T_tns: effective execution time E_g: computing time S: semisupervised analysis L_i: setup experiment U: upload data to grid Fixed 32 CPUs in grid FOOTPRINT dN: #genes x #samples EGEE User Forum, CERN, 01-03.03.2006
Benchmark 2 We study the scalability of our application as function of the number of CPUs through a speed-up measure on different computational environments. • Resources: Linux cluster (ranging from 1 to 8 CPUs) and in grid (from 1 to 32 CPUs). • Data: • Speed-up metric • Def: if E_g[N] is user time of a program from shell command “time” for N CPUs: • Speed-up (N)= E_g[1] / E_g[N] EGEE User Forum, CERN, 01-03.03.2006
LiverCanc: cluster PedLeuk: cluster Experimental data Experimental data 8 8 Linear Speed-up Linear Speed-up 7 7 6 6 5 5 Speedup Speedup 4 4 3 3 2 2 1 1 0 0 1 2 4 8 1 2 4 8 N.Cpu N.Cpu Benchmark 2 Cluster EGEE User Forum, CERN, 01-03.03.2006
LiverCanc: Grid Experimental data 32 Linear Speed-up Speedup 16 8 4 2 1 1 2 4 8 16 32 N.Cpu Benchmark 2 Grid PedLeuk: Grid Experimental data Linear Speed-up 32 Speedup 16 8 4 4 8 16 32 N.Cpu EGEE User Forum, CERN, 01-03.03.2006
Discussion • Two experiments for 139 CPU days in Egrid infrastructure • In Benchmark 1, effective execution time increases linearly with the dataset footprint, i.e. the product of number of genes and number of samples • In Benchmark 2, the speed-up curve is very close to linear • BioDCV system on LCG/EGEE computational grid can be used in practical large scale experiments • BioDCV system will soon be executed on Proteomic data in grid • Next step is porting our system under EGEE’s Biomed VO EGEE User Forum, CERN, 01-03.03.2006
http://biodcv.itc.it • C. Furlanello, M. Serafini, S. Merler and G. Jurman. Semi-supervised learning for molecular profiling. IEEE Trans. Comp. Biology and Bioinformatics, 2(2):110-118, 2005. • More on http://mpa.itc.it BioDCV SubVersion Homepage EGEE User Forum, CERN, 01-03.03.2006
Acknowledgments ICTP E-GRID Project, Trieste Angelo Leto Riccardo Murri Ezio Corso Alessio Terpin Antonio Messina Riccardo Di Meo INFN GRID Roberto Barbera Mirco Mazzuccato IFOM-FIRC and INT, Milano Manuela Gariboldi Marco A. Pierotti Grants: BICG (AIRC) Democritos Data: IFOM-FIRC Cardiogenomics PGA EGEE User Forum, CERN, 01-03.03.2006