Download
1 / 1
30 likes | 216 Vues
Very High Risk. Low Risk. 250. Medium Risk. High Risk. 200. 150. 100. 50. 0. 0. 10. 20. 30. 40. 50. 60. 70. 80. 90. 100. 110. 120. PLAT Index value. Land Use Data: Understand It Before Making Water Quality Rules.

E N D
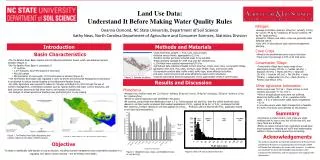
Very High Risk Low Risk 250 Medium Risk High Risk 200 150 100 50 0 0 10 20 30 40 50 60 70 80 90 100 110 120 PLAT Index value Land Use Data: Understand It Before Making Water Quality Rules Deanna Osmond, NC State University, Department of Soil Science Kathy Neas, North Carolina Department of Agriculture and Consumer Sciences, Statistics Division Nitrogen • Average Nfertilizer rates are 84 kg ha-1 (wheat); 133 kg ha-1 (corn); 94 kg ha-1 (tobacco); 87 kg ha-1 (cotton); 49 kg ha-1 (pasture/hay). • Except for tobacco and cotton, crops are generally under fertilized with N. • Only 14% of all producers used nutrient management planning. Introduction Methods and Materials Cover Crops • Used area frame sample; > 4 ha, rural, census blocks. • Selected census blocks, aggregated to 121 ha. • Random number generator selected areas to be sampled. • Fields randomly sampled for 2004 crop year per selected area. • 1,156 fields were selected representing 4,741 ha. • Agricultural data collected included current area (ha), crops, cover crops, conservation tillage, • application rates of N, P2O5 rates, and K2O, slope length, slope, and erosion rates. • Conservation practice data: buffer width, buffer type, acres affected by buffers • and water control structure and acres affected by water control structures. • Used NC Agricultural Nutrient Assessment Tool to approximate off-site P and N losses. Basin Characteristics • Wheat is the predominant cover crop in the basin. • Total cover crop acreage is 14% of all total acres. • The Tar-Pamlico River Basin empties into the Albermarle-Pamlico Sound, which was declared nutrient sensitive (Figure 1). • The Tar-Pamlico River Basin is comprised of • 17 counties • 1.2 M hectares; 323,749 hectares of farm land • 400,000 people • 290 kilometers of river length; 37,015 kilometers of streams (Figure 2). • The Tar-Pamlico River Basin was regulated in 2001 by the NC Environmental Management Commission in an attempt to reduce nutrient loading to the Albermarle-Pamlico Sound. • By 2006, agriculture was required to reduce its nitrogen contribution by 30% through the use of nutrient management, conservation practices such as riparian buffers and water control structures, and land conversion and ensure that there was no net increase in phosphorus. • No analysis of actual agricultural practices was performed prior to rule making. Conservation Tillage • Conservation tillage had a large range of use: Washington County (97.5% ) > Halifax (62.4%) > Beaufort (57.0%) = Martin (56.7%) > Granville (51.4%) > Franklin (45.1%) > Pitt (40.8%) = Hyde (39.6%) > Edgecombe (30.1%) > Nash (24.8%) > Pamlico and Wilson (0%). Figure 3. Sample locations Results and Discussion Other Agronomic Information Phosphorus • Mean erosion was 7.9 t ha-1. Mean soil loss in most counties was under “T” (11 t ha-1). • 40% of all agricultural acres were not buffered. • Mean tree buffer width = 35 m; vegetative buffer width = 9 m; 2-tiered buffer width (trees+vegetative) = 27 m. • In counties where water table management is feasible, 6 to 62% of all acres were affected by this practice. • Average P2O5 fertilizer rates are 25.8 kg ha-1 (wheat); 85 kg ha-1 (corn); 78 kg ha-1 (tobacco); 38 kg ha-1 (cotton); 10 kg ha-1 (pasture/hay). • Almost no animal agriculture was identified in this basin. • All counties, except Hyde and Washington have 1.5 to 3 times greater soil test P2O5 than the critical threshold value. • Based on soil test results, producers that needed applications of P2O5 applied 32 kg ha-1 of P2O5 ; producers that did NOT need P2O5 fertilizer (based on soil test) applied 32 of P2O5 . Producers did not discriminate P2O5 application based on soil test recommendations. Summary Wesley Childres • Soil erosion is under control, most crops are under fertilized with N, have a very low off-site loss of P, and many fields are buffered. • Efforts to reduce nutrients from agriculture should have been targeted on reducing soil test P and implementing buffers in those counties where they are lacking. Acknowledgements Figure 1. Tar-Pamlico River Basin Boundaries and position relative to the state of North Carolina Figure 2. Land use in the Tar-Pamlico River Basin The authors would like to thank NC Department of Environment and Natural Resources in supplying the pass-through USEPA 319 funds that allowed us to conduct this research. In addition, we would like to thank the NCDA&CS enumerators, who conducted the interviews, and the producers who supplied the information. Objective To obtain a statistically valid sample of crop production, including nutrient management and conservation practices in a regulated river basin in North Carolina – the Tar-Pamlico River Basin. Figure 5. Risk of P loss as derived from the Figure 4. Weighted mean, mean, and NCDA&CS mean of soil test P2O5