Valvular Regurgitation
Valvular Regurgitation. Susan A. Raaymakers, MPAS, PA-C, RDCS (AE)(PE) Assistant Professor of Physician Assistant Studies Radiologic and Imaging Sciences - Echocardiography Grand Valley State University, Grand Rapids, Michigan raaymasu@gvsu.edu du. Basic Principles. Etiology Congenital


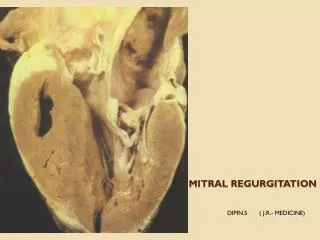
Valvular Regurgitation
E N D
Presentation Transcript
Valvular Regurgitation Susan A. Raaymakers, MPAS, PA-C, RDCS (AE)(PE) Assistant Professor of Physician Assistant Studies Radiologic and Imaging Sciences - Echocardiography Grand Valley State University, Grand Rapids, Michigan raaymasu@gvsu.edu du
Basic Principles Etiology • Congenital • Acquired abnormalities
Fluid Dynamics of Regurgitation Characterized • Regurgitant orifice area • High-velocity regurgitant jet • Proximal flow convergence area • Downstream flow disturbance • Increased antegrade flow volume
Fluid Dynamics of Regurgitation Regurgitant orifice • characterized by high-velocity laminar jet • Related to instantaneous pressure difference (∆P=4v2) • Upstream side of regurgitant acceleration proximal to regurgitant orifice • PISA • Narrowest segment of the regurgitant jet occurs just distal to the regurgitant orifice reflects regurgitant orifice area • Vena Contracta
Fluid Dynamics of Regurgitation Size, Shape and Direction of Regurgitant Jet • Size • Affected by physiologic and technical factors • Regurgitant volume • Driving pressure • Size and shape of regurgitant orifice • Receiving chamber constraint • Influence of coexisting jets or flowstreams • Ultrasound system gain • Depth • Signal strength
Fluid Dynamics of Regurgitation Size, Shape and Direction of Regurgitant Jet • Shape and Directions • Affected by • Anatomy and orientation of regurgitant orifice • Driving force across the valve • Size and compliance of receiving chamber
Volume Overload • Total Stroke Volume • Total volume of blood pumped by the ventricle in a single beat • Forward Stroke Volume • Amount of blood delivered to the peripheral circulation • Regurgitant Volume • Amount of backflow across the abnormal valve
Volume Overload Chronic valvular regurgitation • Results in progressive volume overload of the ventricle • Volume overload in LV results in LV chamber enlargement with normal wall thickness (total LV mass is increased) • Important clinical feature: • An irreversible decrease in systolic function can occur in absence of symptoms
Detection of Valvular Regurgitation • 2D imaging • Indirect evidence • Chamber dilation and function • Color flow imaging • Flow disturbance downstream form regurgitant orifice • Sensitive (90%) when correct settings are utilized • Specific (nearly 100%) compared with angiography • True positives and false positives • False positives due to mistaken origin or timing • False negatives due to low signal strength or inadequate images
Detection of Valvular Regurgitation • Continuous-wave Doppler ultrasound • Identification of high velocity jet through regurgitant orifice • Advantage: • Beam width is broad at the level of the valves when studied from an apical approach
Valvular Regurgitation in Normal Individuals • Physiologic • Small degree of regurgitation in normal individuals • No adverse implications • Typically • Spatially restricted to area immediately adjacent to valve closure • Short in duration • Represents on a small regurgitant volume • May be detected in 70 – 80% mitral • May be detected in 80 – 90% tricuspid • May be detected in 70 – 80% pulmonary • May be detected in 5% aortic (increases with age). • Clinical significance of AI is unknown
Approaches to Evaluation of the Severity of Regurgitation • Semi-quantitative measures • Mild, moderate or severe utilizing • Color jet area • Vena contracta width • Pressure half-time (for aortic insufficiency) • Distal flow reversals
Approaches to Evaluation of the Severity of Regurgitation • Quantitative measures • Regurgitant volume (RV) • Retrograde volume flow across the valve • Expressed either as • Instantaneous flow rate in ml/sec • Averaged over the cardiac cycle in ml/beat • Calculated by • PISA • Volume flow rates across the regurgitant and competent valve (Spectral Doppler Technique) • 2D total left ventricular stroke volume minus Doppler forward stroke volume • Regurgitant fraction • RF = RV/SV total • Regurgitant orifice area
Effective Regurgitant Orifice Area (EROA) • Application of continuity equation • “what flows in must flow out” • Based on theory of conservation of mass • May be calculated utilizing • Spectral Doppler technique • Application of the PISA method
Spectral Doppler Technique • Regurgitant volume through an incompetent valve is equal to the flow at the regurgitant orifice • Stroke volume may be calculated from the CSA and the VTI • RVol = EROA x VTIRJ • RVol = Regurgitant volume (cc) • EROA = Effective regurgitant orifice area (EROA) • VTIRJ = Velocity time integral of the regurgitant jet (cm) • Rearrange equation • EROA = RVOL/VTIRJ Non-dynamic
Spectral Doppler Technique“Step by Step” • Calculate stroke volume (SV) through LVOT • Calculate stroke volume (SV) through MV • Calculate the regurgitant volume (cc) • Measurement of VTI of regurgitant signal • Calculate the effective regurgitant area (cm2) Non-dynamic
Spectral Doppler Technique“Step by Step” • Calculate stroke volume (SV) through LVOT • Measure LVOT diameter from PLAX • Inner edge to inner edge • CSA = 0.785 x D2 • Measure the LVOT VTI from apical long axis or apical four chamber anterior tilt • SV (cc) = CSA (cm2) * VTI (cm)
Spectral Doppler Technique“Step by Step” • Calculate the stroke volume through the mitral valve • Measure the mitral valve annulus • Apical four chamber at mid-diastole: inner edge to inner edge • CSA = 0.785 x D2 • Measure mitral annulus VTI • PW Doppler at the level of the annulus • SV (cc) = CSA (cm2) * VTI (cm)
Spectral Doppler Technique“Step by Step” • Calculate the regurgitant volume • R Vol(MR) = SV (MV) – SV (LVOT) • Measurement of VTI of regurgitant signal • Optimize CW Doppler spectrum of regurgitant signal
Spectral Doppler Technique“Step by Step” • Calculate the effective regurgitant orifice area (EROA in cm2) • EROA = RVol(MR) ÷ VTI(MR)
Spectral Doppler TechniqueLimitations • Accuracy of measurements • Inadequate spectral Doppler envelope for mitral regurgitation VTI measurement • Significant learning curve • May be considered time consuming and tedious
Spectral Doppler TechniqueClinical Significance of the EROA and Mitral Regurgitation
Color Doppler Imaging • Jet Area • Screening for significant flow often based on flow disturbance in receiving chamber • Size of flow disturbance evaluated in at least two views • Important to evaluate color flow disturbance based on cardiac cycle timing • Size of jet relative to receiving chamber provides qualitative index of regurgitant severity on scale of 0(mild) - 4+(severe)
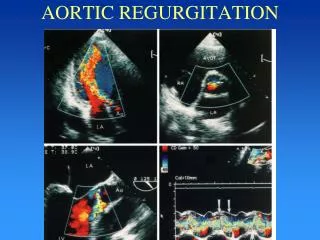
Color Doppler Imaging • Aortic Regurgitation • Best evaluated from PLAX approach • Shorter distance from transducer to flow region of interest: better signal to noise ratio • Multiple flow directions within jet
Color Doppler Imaging - Mmode • Evaluation of exact timing of flow • In relation to QRS and valve opening and closure • Higher sampling rate
Vena Contracta • Narrowest diameter of the flow stream • Reflects diameter of regurgitant orifice • Relatively unaffected by instrument settings • Recommended • Perpendicular to jet width • Zoom mode • Narrow sector and depth Non-dynamic
Proximal Isovelocity Surface AreaBasic Principle • Based on conservation of energy • PISA measurement analogous to calculation of stroke volume proximal to a stenotic valve • Variation of continuity equation • Flow rate proximal to a narrowed orifice is the product of the hemispheric flow convergent area and the velocity of that isovelocity shells • Expressed by Q = 2r2Vr • Q = flow rate • 2r2 = area of hemispheric shell (cm2) • Vr = velocity at the radial distance – r(cm/s) Non-dynamic
Proximal Isovelocity Surface AreaBasic Principle • Continuity principle: blood flow passing through a given hemisphere must ultimately pass through he narrowed orifice • Flow rate through any given hemisphere must equal the flow rate through the narrowed orifice • 2r2Vr = A0*V0 • A0 = area of the narrowed orifice (cm2) • V0 = peak velocity through the narrowed orifice (cm/s) • Rearrange the equation • A0 = (2r2Vr )/V0 Non-dynamic
Proximal Isovelocity Surface AreaBasic Principle • Continuity principle: blood flow passing through a given hemisphere must ultimately pass through he narrowed orifice • Flow rate through any given hemisphere must equal the flow rate through the narrowed orifice • 2r2Vr = A0*V0 • A0 = area of the narrowed orifice (cm2) • V0 = peak velocity through the narrowed orifice (cm/s) • Rearrange the equation • A0 = (2r2Vr )/V0
Proximal Isovelocity Surface Area(PISA) Application in Calculation of Effective Orifice Area (EROA) • Regurgitant valve acts as the narrowed orifice • Peak velocity is equivalent to the peak velocity of the regurgitant jet • Utilizing Doppler colorflow radius and velocity at the radial distance can be identified
Proximal Isovelocity Surface Area(PISA) Application in Calculation of Effective Orifice Area (EROA) • Adjustment of Nyquist limit enlarges size of shell for more accurate measurement • Shift baseline to downward typically 20 to 40 cm/sec • The surface area of a hemisphere is calculated by the formula: • Surface area = 2πr2 • Multiplication of aliasing velocity with surface area yields regurgitant volume Non-dynamic
Proximal Isovelocity Surface Area • Effective Regurgitant Orifice Area (ROA) • EROA = RVmax /VMR • RVmax : Regurgitant Volume (cm3) • VMR : Velocity of mitral regurgitation (cm/sec) Non-dynamic
Steps for Obtaining PISA Regurgitant Orifice Area • Zoom mitral valve • Decrease color scale to identify surface of hemisphere shell • Note alias velocity – color bar (Valiasing) • Measure alias from orifice to color change (r) • Regurgitant volume • RVmax = 2 r2 x Valiasing • Measure peak mitral regurgitant velocity (VMR) • Effective Regurgitant Orifice Area • EROA = RVmax/VMR
Steps for Obtaining PISA Regurgitant Orifice Area Surface area = 2r2 2(0.67 cm)2 = 2.80 cm2 Regurgitant Volume Flow Rate RVmax=Surface Area* Valiasing 2.80 cm2 * 26 cm/sec =72.8 cm3/sec Effective Regurgitant Orifice Area EROA = RVmax/VMR (72.8 cm3/sec) / (66.2 cm/sec) = 1.1 cm2 0.67cm
Simplified Method for Calculation of the Mitral Regurgitant Volume • May be employed when appropriate CW jet is unable to be obtained (i.e. eccentric jet) • Based on premise: • Ratio of maximum MR velocity to VTI MR is equal to a constant of 3.25 • Regurgitant volume = (2r2Valiasing)/3.25 • 2r2 = area of hemispheric shell derived from the radius [r] (cm2) • Valiasing = aliased velocity identified as the Nyquist limit (cm/s) • 3.25 constant
Clinical Significance of the PISA Radius and Valvular Regurgitation
Proximal Isovelocity Surface Area – EROA MV Considerations • Assumption is made that RVmax and VMR occur at the same position in the cardiac cycle • PISA is larger in large volume sets and smaller in smaller volume sets • Also changes size in accordance with color Doppler scale • PISA should be recorded in a view parallel to flow stream typical apical four chamber • If PISA is hemi-elliptical or if valve is nonplanar, alternate approach or alternate corrections
PISA Limitations • Nonoptimal flow convergence • Phasic changes • Eccentric jets • Interobserver variability • Isovelocity surface not always hemisphere • PISA model is a sphere. Mitral regurgitant orifice may be irregular • Multiple regurgitant jets • May not be able to completely envelope the mitral regurgitation trace • Mitral flow rate will vary throughout systole
PISA – EROALimitations • Nonoptimal flow convergence Suboptimal Flow Convergence Flow: not symmetric Suboptimal Flow Convergence Perforated mitral leaflet - TEE
Continuous Wave Doppler Approach • Signal intensity • Proportional to number of blood cells contributing to regurgitant signal • Compare retrograde to antegrade flow intensity • Weak signal = mild regurgitation • Strong signal = severe regurgitation • Intermediate signal = moderate regurgitation
Continuous Wave Doppler Approach • Antegrade flow velocity • Regurgitation results in increase in antegrade flow across the incompetent valve • Greater the severity of regurgitation; the greater the antegrade flow velocity • Consideration of co-existent stenosis
Continuous Wave Doppler Approach • Time course (shape) of mitral regurgitant velocity curve • Dependent on time-varying pressure gradient across regurgitant orifice • Related to pressure gradient • Normal LV systolic pressure = 100 – 140 mmHg • Normal LA systolic pressure = 5 – 15 mmHg • Difference therefore: 85 – 135 mmHg • MR velocity is typically 5 – 6 m/sec
Continuous Wave Doppler Approach • Time course (shape) of mitral regurgitant velocity curve • Normal LV systolic function: • Rapid acceleration to peak velocity • Maintenance of high velocity in systole • Rapid deceleration prior to diastolic opening of the mitral valve • Increase in left atrial pressure results in late systolic decline in the instantaneous pressure gradient
Continuous Wave Doppler Approach • Shape of aortic regurgitant curve • Dependent on time course of diastolic pressure difference • Normal low end-diastolic pressure • Aortic end-diastolic pressure is normal (high pressure difference) • Slow rate of pressure decline • Acute AI results in more rapid velocity decline in diastole
Continuous wave Doppler across AV Decel = 270 cm/sec