Download
1 / 8
80 likes | 299 Vues
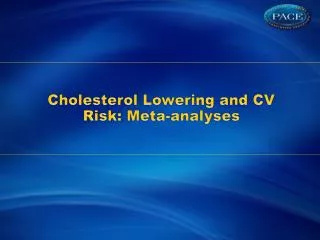
Cholesterol Lowering and CV Risk: Meta-analyses. On-Treatment LDL and CHD Events in Statin Trials. 30. 4S - PBO. Secondary Prevention. 4S - Rx. 20. LIPID - PBO. Event rate (%). CARE - PBO. LIPID - Rx. HPS - PBO. Primary Prevention. CARE - Rx. 10. HPS - Rx. TNT - ATV10.

E N D
On-Treatment LDL and CHD Events in Statin Trials 30 4S - PBO Secondary Prevention 4S - Rx 20 LIPID - PBO Event rate (%) CARE - PBO LIPID - Rx HPS - PBO Primary Prevention CARE - Rx 10 HPS - Rx TNT - ATV10 WOSCOPS - PBO TNT - ATV80 PROVE-IT - PRA AFCAPS - PBO PROVE-IT - ATV80 AFCAPS - Rx WOSCOPS - Rx WOSCOPS - Rx ASCOT - PBO ASCOT - Rx 0 40 (1.0) 60 (1.6) 70 (1.8) 80 (2.1) 100 (2.6) 120 (3.1) 140 (3.6) 160 (4.1) 180 (4.7) 200 (5.2) LDL-C achieved, mg/dL (mmol/L) Adapted from Rosenson RS. Expert Opin Emerg Drugs. 2004;9:269-279.LaRosa JC et al. N Engl J Med. 2005;352:1425-1435.
Second Cycle of the CTT Meta-analysis: Proportional Effects on Major VascularEvents Per Mmol/L LDL-C Reduction No. of events (% pa) Relative risk (CI) per mmol/L LDL-C reduction Statin/more Control/less More vs. less statin 406 (11.3) 458 (13.1) PROVE-IT 257 (7.2) 282 (8.1) A to Z 889 (4.0) 1164 (5.4) TNT 938 (5.2) 1106 (6.3) IDEAL 1347 (3.6) 1406 (3.8) SEARCH Subtotal (5 trials) 0.72 (0.66 - 0.78) P < 0.001 3837 (4.5) 4416 (5.3) Statin vs. control First cycle (14 trials) 5883 (3.1) 7467 (4.0) 0.78 (0.76 - 0.81) 254 (5.4) 293 (6.4) ALLIANCE 144 (9.0) 162 (10.1) 4D 114 (2.7) 136 (3.3) ASPEN 102 (0.5) 140 (0.7) MEGA 105 (0.5) 194 (1.0) JUPITER 172 (2.2) 174 (2.2) GISSI-HF 362 (8.1) 368 (8.3) AURORA 7136 (2.8) 8934 (3.6) Subtotal (21 trials) 0.79 (0.77 - 0.81) P < 0.001 Total (26 trials) 10973 (3.2) 13350 (4.0) 0.78 (0.76 - 0.80) P < 0.001 0.5 0.75 1 1.25 1.5 99% or 95% CI Statin/more better Control/less better Difference between more vs. less and statin vs. control: c 2 4.5, p=0.03 = 1 Cholesterol Treatment Trialists Collaboration. Lancet. 2010;376:1670-1681.
Second Cycle of the CTT Meta-analysis:More vs Less Statin—Proportional Effects onMajor Vascular Events Per Mmol/L LDL-C Reduction No. of events (% pa) Relative risk (CI) per mmol/L LDL-C reduction More statin Less statin 1175 (1.3%) 1380 (1.5%) 0.71 (0.58 - 0.87) Nonfatal MI 645 (0.7%) 694 (0.7%) 0.85 (0.63 - 1.15) CHD death Any major coronary event 1725 (1.9%) 1973 (2.2%) 0.74 (0.65 - 0.85) P < 0.0001 637 (0.7%) 731 (0.9%) 0.72 (0.55 - 0.95) CABG 1166 (1.3%) 1508 (1.8%) 0.60 (0.50 - 0.71) PTCA Unspecified 447 (0.5%) 502 (0.6%) 0.78 (0.58 - 1.04) Any coronary revascularization 2250 (2.6%) 2741 (3.2%) 0.66 (0.60 - 0.73) P < 0.0001 440 (0.5%) 526 (0.6%) 0.69 (0.50 - 0.95) Ischemic stroke Hemorrhagic stroke 69 (0.1%) 57 (0.1%) 1.39 (0.57 - 3.39) 63 (0.1%) 80 (0.1%) 0.63 (0.24 - 1.66) Unknown stroke Any stroke 572 (0.6%) 663 (0.7%) 0.74 (0.59 - 0.92) P = 0.007 99% or 95% CI Any major vascular event (5 trials) 3837 (4.5%) 4416 (5.3%) 0.72 (0.66 - 0.78) 0.5 0.75 1 1.25 1.5 More statin better Less statin better Cholesterol Treatment Trialists Collaboration. Lancet. 2010;376:1670-1681.
Second Cycle of the CTT Meta-analysis: Statinvs Control—Proportional Effects onMajor Vascular Events Per Mmol/L LDL-C Reduction No. of events (% pa) Relative risk (CI) per mmol/L LDL-C reduction Statin Control 2310 (0.9%) 3213 (1.2%) 0.74 (0.69 - 0.78) Nonfatal MI 1242 (0.5%) 1587 (0.6%) 0.80 (0.73 - 0.86) CHD death Any major coronary event 3380 (1.3%) 4539 (1.7%) 0.76 (0.73 - 0.79) P < 0.001 816 (0.3%) 1126 (0.4%) 0.76 (0.69 - 0.83) CABG 601 (0.2%) 775 (0.3%) 0.78 (0.69 - 0.89) PTCA Unspecified 1686 (0.6%) 2165 (0.8%) 0.76 (0.70 - 0.83) Any coronary revascularization 3103 (1.2%) 4066 (1.6%) 0.76 (0.73 - 0.80) P < 0.001 987 (0.4%) 1225 (0.5%) 0.80 (0.73 - 0.88) Ischemic stroke Hemorrhagic stroke 188 (0.1%) 163 (0.1%) 1.10 (0.86 - 1.42) 555 (0.2%) 629 (0.2%) 0.88 (0.76 - 1.02) Unknown stroke Any stroke 1730 (0.7%) 2017 (0.8%) 0.85 (0.80 - 0.90) P < 0.001 Any major vascular event (all 21 trials) 7136 (2.8%) 8934 (3.6%) 0.79 (0.77 - 0.81) P < 0.001 0.5 0.75 1 1.25 1.5 99% or 95% CI Statin better Control better Cholesterol Treatment Trialists Collaboration. Lancet. 2010;376:1670-1681.
Meta-analysis of Statin Trials and Fatal and Nonfatal Stroke N = 165,732 Active group (%) Control group (%) RR (95% CI) RR (95% CI) Study Primary prevention of stroke SEARCH JUPITER ASPEN MEGA IDEAL TNT ALLIANCE CARDS PROVE-IT A TO Z ASCOT-LLA ALLHAT-LLT GREACE HPS (with no prior CVD) PROSPER MIRACL GISSI AFCAPS/TexCAPS LIPID (with no prior CVD) Post-CABG CARE (with no prior CVD) WOSCOPS SSSS Sub-total:P < 0.0001 (heterogeneity: I2 = 26.6%, P = 0.12) 4.2 0.4 2.8 1.3 3.4 2.3 2.9 1.5 1.0 1.2 1.7 4.0 1.2 3.2 4.7 0.8 0.9 0.4 3.3 2.6 1.9 1.4 2.5 4.6 0.7 3.2 1.6 3.9 3.1 3.2 2.8 0.9 1.6 2.4 4.5 2.1 4.8 4.5 1.6 0.9 0.5 3.9 2.4 2.8 1.5 3.5 0.91 (0.77, 1.08) 0.52 (0.34, 0.78) 0.89 (0.56, 1.40) 0.83 (057,1.20) 0.87 (0.70, 1.08) 0.76 (0.60, 0.96) 0.90 (0.58, 1.42) 0.53 (0.31, 0.90) 1.09 (0.59, 2.01) 0.79 (0.48, 1.29) 0.73 (0.56, 0.96) 0.91 (0.76, 1.09) 0.53 (0.24, 1.18) 0.67 (0.57, 0.77) 1.04 (0.82, 1.31) 0.50 (0.25, 1.00) 1.05 (0.56, 1.96) 0.82 (0.41, 1.67) 0.84 (0.67, 1.05) 1.12 (0.58, 2.18) 0.67 (0.44, 1.01) 0.90 (0.61, 1.34) 0.72 (0.51, 1.01) 0.81 (0.75, 0.87) Secondary prevention of stroke SPARCL HPS (with prior CVD LIPID (with prior CVD) CARE (with prior CVD) Sub-total:P = 0.03 (heterogeneity: I2 = 0.8%, P = 0.39) 11.2 10.3 9.5 13.5 13.1 10.4 13.3 20.0 0.85 (0.73, 0.99 0.99 (0.81, 1.21) 0.72 (0.46, 1.12) 0.68 (0.37, 1.25) 0.88 (0.78, 0.99) 0.82 (0.77, 0.87 Total: P < 0.0001 (heterogeneity: I2 = 7.3%, P = 0.36) 0.1 0.2 0.5 1 2 5 10 Amarenco P et al. Lancet Neurol. 2009;8:453-463. Log-scale
Meta-analysis of Statin Trials and Stroke Mortality Active group (%) Control group (%) RR (95% CI) RR (95% CI) Study Primary prevention of stroke SEARCH JUPITER CARDS ALLHAT-LLT GREACE HPS PROSPER MIRACL GISSI LIPID CARE WOSCOPS SSSS Sub-total:P = 0.18 (heterogeneity: I2 = 0%, P = 0.48) 0.9 0.3 0.1 1.0 0.0 0.9 0.8 0.2 0.2 0.5 0.2 0.2 0.6 1.1 0.7 0.5 1.1 0.1 1.2 0.5 0.1 0.2 0.6 0.1 0.1 0.5 0.85 (0.60, 1.21) 0.50 (0.13, 2.00) 0.14 (0.02, 1.15) 0.95 (0.65, 1.38) 0.33 (0.01, 8.17) 0.81 (0.62, 1.05) 1.58 (0.81, 3.09) 1.51 (0.25, 9.02) 1.00 (0.25, 3.98) 0.81 (0.46, 1.43) 4.99 (0.58, 42.70) 1.50 (0.42, 5.30) 1.17 (0.54, 2.52) 0.90 (0.76, 1.05) Secondary prevention of stroke SPARCL 1.0 1.7 0.59 (0.36, 0.97) Total: P = 0.10 (heterogeneity: I2 = 8.1%, P = 0.36) 0.87 (0.73, 1.03) 0.1 0.2 0.5 1 2 5 10 Log-scale Amarenco P et al. Lancet Neurol. 2009;8:453-463.
Stroke Risk and LDL Lowering inStatin Trials Each 1 mmol (39 mg) LDL-C reduction reduced the risk of stroke by 21% (95% CI, 6.3–33.5%; p<0.009) 1.2 Post-CABG N = 165,732 PROVE-IT 1.1 GISSI PROSPER ALLHAT-LLT 1.0 SEARCH SPARCL-CS (-) WOSCOPS IDEAL 0.9 ASPEN LIPID ALLIANCE SPARCL AFCAPS/TexCAPS 0.8 MEGA A to Z Relative Risk of Stroke in Active vs Control Groups (non-log scale) ASCOT-LLA TNT HPS 0.7 SPARCL-CS (+) SSSS CARE 0.6 CARDS JUPITER 0.5 GREACE MIRACL 0.4 0 0 -10 -15 -20 -25 -30 -35 -40 -45 -50 -55 Between Group Difference in LDL-Cholesterol Reduction, % (active minus control groups) Amarenco P et al. Lancet Neurol. 2009;8:453-463.