Download
1 / 25
260 likes | 443 Vues
Toxicology, Solid and Hazardous Waste Treatment. Brian Kaestner Saint Mary’s Hall. Thanks to Miller and Clements. Toxicology. DDT in fish-eating birds (ospreys) 25 ppm. DDT in large fish (needle fish) 2 ppm. DDT in small fish (minnows) 0.5 ppm. DDT in zooplankton 0.04 ppm.

E N D
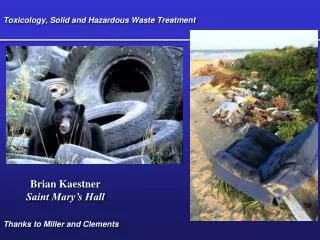
Toxicology, Solid and Hazardous Waste Treatment Brian Kaestner Saint Mary’s Hall Thanks to Miller and Clements
Toxicology DDT in fish-eating birds (ospreys) 25 ppm DDT in large fish (needle fish) 2 ppm DDT in small fish (minnows) 0.5 ppm DDT in zooplankton 0.04 ppm Number of individuals affected Very Sensitive Majority of population Very Sensitive 0 20 40 60 80 Dose (hypothetical units) • Toxicity • Dosage • Bioaccumulation DDT in water 0.000003 ppm, Or 3 ppm • Biomagnification • Synergism • Acute effect • Chronic effect
Poisons 100 75 Percentage of population killed by a given dose 50 LD 50 0 2 4 6 8 10 12 14 16 Dose (hypothetical units) • Poison • LD50 25
Chemical Hazards • Hazardous chemicals • Mutagens • Teratogens • Carcinogens • Neurotoxins • Precautionary principle
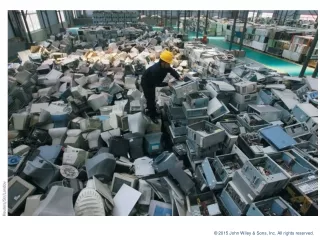
Wasting Resources Dumped in landfills (54%) Mining and oil and gas production 75% Burned in incinerators (16%) Recycled or composted (30%) Industry 9.5% Agriculture 13% • Industrial and agricultural waste • Municipal solid waste • US: 1,600 lb/person Sewage sludge 1% Municipal 1.5%
Hazardous Wastes • Contains one or more of 39 identified compounds • Catches fire easily • Reactive or explosive • Corrodes metal containers
Producing Less Waste and Pollution • Waste management (high waste approach) • Burying, burning, shipping • Waste prevention (low waste approach) • Reduce, reuse, recycle • Chemical or biological treatment • Burial
Dealing with Materials Use and Wastes 1st Priority 2nd Priority Last Priority Primary Pollution and Waste Prevention Secondary Pollution and Waste Prevention Waste Management • Reduce products • Repair products • Recycle • Compost • Buy reusable and recyclable products • Change industrial process to eliminate use of harmful chemicals • Purchase different products • Use less of a harmful product • Reduce packaging and materials in products • Make products that last longer and are recyclable, reusable or easy to repair • Treat waste to reduce toxicity • Incinerate waste • Bury waste in landfill • Release waste into environment for dispersal or dilution Fig. 21.4, p. 521
Hazardous Waste Regulation in the United States • Resource Conservation and Recovery Act • Comprehensive Environmental Response, Compensation, and Liability Act • Superfund • National Priority List • Polluter-pays principle
Dealing with Hazardous Wastes Produce Less Waste Manipulate processes to eliminate or reduce production Recycle and reuse Convert to Less Hazardous or Nonhazardous Substances Chemical physical, and biological treatment Ocean and atmospheric assimilation Thermal treatment Land treatment Incineration Put in Perpetual Storage Aridregion unsaturated zone Underground injection Waste piles Surface impoundments Salt formations Landfill
Above Ground Hazardous Waste Disposal Waste transporter Elevator shaft Hazardous waste Support column Inspector
Deep-well Disposal Advantages Disadvantages Safe method if sites are chosen carefully Wastes can be retrieved if problems develop Low cost Leaks or spills at surface Leaks from corrosion of well casing Existing fractures or earth quakes can allow wastes to escape into groundwater Encourages waste production
Sanitary Landfill When landfill is full, layers of soil and clay seal in trash Electricity generator building Methane storage and compressor building Topsoil Leachate treatment system Sand Clay Garbage Pipe collect explosive methane gas used as fuel to generate electricity Methane gas recovery Leachate storage tanks Compacted solid waste Garbage Sand Synthetic liner Clay and plastic lining to prevent leaks; pipes collect leachate from bottom of landfill Sand Leachate monitoring well Leachate monitoring well Leachate pumped up to storage tanks for safe disposal Leachate pumped up to storage tanks for safe disposal Clay Groundwater monitoring well Groundwater monitoring well Subsoil Leachate pipes Groundwater Leachate pipes Groundwater
Advantages Disadvantages No open burning Little odor Low groundwater pollution if sited properly Can be built quickly Low operating costs Can handle large amounts of waste Filled land can be used for other purposes No shortage of landfill space in many areas Noise and traffic Dust Air pollution from toxic gases and volatile organic compounds release greenhouse gases (methane and CO2) Groundwater contamination Slow decomposition of wastes Encourages waste production Eventually leaks and can contaminate groundwater
Power plant Steam Smokestack Electricity Turbine Generator Crane Wet scrubber Boiler Electrostatic precipitator Furnace Conveyor Dirty water Fly ash Water Bottom ash Waste pit Conven- tional landfill Hazardous Waste landfill Waste treatment
Burning Wastes Advantages Disadvantages Reduced trash volume Less need for landfills Low water pollution High cost Air pollution (especially toxic dioxins) Produces a highly toxic ash Encourages waste production • Mass burn incineration • Air pollution • Waste to energy
Reuse • Extends resource supplies • Reduces energy use • Reusable shipping containers and grocery bags
Recycling Aluminum can, used once Steel can used once Recycled steel can Glass drink bottle used once Recycled aluminum can Recycled glass drink bottle Refillable drink bottle, used 10 times 0 8 16 24 32 Energy (thousands of kilocalories) • Primary (closed-loop) • Post consumer waste
Characteristics of Recyclable Materials • Easily isolated from other waste • Available in large quantities • Valuable
Benefits of Recycling Reduces global warming Reduces acid deposition Reduces urban air pollution Make fuel supplies last longer Reduces air pollution Saves energy Reduces energy demand Reduces solid waste disposal Recycling Reduces mineral demand Reduces water pollution Reduces habitat destruction Protects species Fig. 21.7, p. 530
Recycling in the US • Centralized recycling of mixed waste (MRFs) • Separated recycling • Economic benefits • Increasing recycling in the US
Case Studies: Recycling Aluminum, Wastepaper, and Plastics • 40% of aluminum recycled in US • Recycled aluminum uses over 90% fewer resources • Paper: preconsumer vs. postconsumer recycling • 10% or less of plastic recycled in US
Solutions: Achieving a Low-Waste Society • Local grassroots action • International ban on 12 persistent organic pollutants (the dirty dozen) • Cleaner production