Download
1 / 38
380 likes | 399 Vues
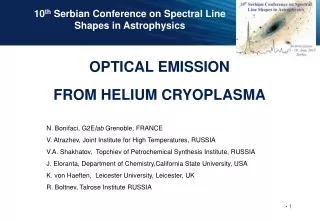
10 th Serbian Conference on Spectral Line Shapes in Astrophysics. OPTICAL EMISSION FROM HELIUM CRYOPLASMA. N. Bonifaci, G2E lab Grenoble, FRANCE V. Atrazhev, Joint Institute for High Temperatures, RUSSIA V.A. Shakhatov, Topchiev of Petrochemical Synthesis Institute, RUSSIA

E N D
10th Serbian Conference on Spectral Line Shapes in Astrophysics OPTICAL EMISSION FROM HELIUM CRYOPLASMA N. Bonifaci, G2Elab Grenoble, FRANCE V. Atrazhev, Joint Institute for High Temperatures, RUSSIA V.A. Shakhatov, Topchiev of Petrochemical Synthesis Institute, RUSSIA J. Eloranta, Department of Chemistry,California State University, USA K. von Haeften, Leicester University, Leicester, UK R. Boltnev, Talrose Institute RUSSIA
G2E. Labcovers the widespectrum of the electrical engineering science Frommaterials to system Fromprocesses to actuators From µsystem to large power systemes From productions to usage of electrical power
Streamer discharges in liquid Negative streamer Positive streamer V < 1km/s FAST MODE 10 – 30 km/s N2 N2 time time 100 kV 100 kV • This process in dense fluids is very complex that involves: • - electronic phenomena: electron injection, electron impact, excitation and ionization • thermal phenomena: phase change • - hydrodynamic phenomena: formation of pressure waves, propagation of discharge channels.
Motivation Discharge in dense fluids (liquids or high-pressure gases :1-100 bar) Collision-radiative model + µ-discharge Liquid Helium Gas liquid Temperature: 300 K Density N: 2 1019 cm-3 4.2 K 2 1022 cm-3 nanoscopic probes Interaction of He*atoms,He2*molecules, and e-,He+ with helium in various thermodynamic phases and states Condensed matter physics
Physics of the micro-discharge Photograph of micro discharge Ionization zone : Ep~ MV/cm Light emission Plasma tip Densities of the electrons, atomic and molecular ions (Ne and Np), temperature, etc. Important input parameters for the collision-radiative model in the theoretical study of the micro-discharges Transport zone : E ~ kV/cm µe and µ+ I(V) Mobility of the charged particles depends on physical properties of the surrounding media (viscosity…) V ~ kV DC, I ~ 0,1-50µA P=0,1-100mW, gap distance~5-8 mm Rtip ~ 0,1-2µm
Experimental setup d7mm Rp0.1-2mm Phase diagram Solid Supercritical Liquid Pressurizedheliumcell Superfluid Critical Point Tc=5.2 K Pc=2.2 Bar • Pressure: 0.110 MPa • V: 20 kV • Temperature: 4,2 K300 K 4K 14 K Gas • 6
Optical spectroscopic investigation Discharge in liquid Helium at 4.2 K, in supercritical helium at 14 K He* lines and molecular excimers He2* • 706 nm line He I (3s3S-2p3P) • 640 nm molecular band He2(d3Su+-b3Pg)
Electron mobility I~10-50µA Free e- Transition Low mobility I~0,1 µA liquid µ~0,02 cm2/Vs
Electron bubbles in liquid 4He The repulsive interaction occurring between e- and helium atoms. He localizes electrons in «bubbles» R ~20 Å P=0.1 MPa T= 4.2 K R~20Å He atom Microscopic cavity: « Bubble » e- surface energy PV energy
Discharge in liquidhelium at 4.2 KLine shape of 706 nm in liquid He at 4.2 K 706 nm line (3s3S-2p3P) observed in liquid helium Gas 300 K Pressure Pressure Main line disappears Blue satellite Unified semiclassical theory symmetrical Gaussian profile N ALLARD, et al EPL 88 (2009) 53002 N ALLARD, et al EPJ D 61 (2011) 365-372 Strongly Blue shifted
Line shape of 706 nm (3S-3P) Logarithmic scale Liquid He 4,2 K Gas He 300 K Interpretation: Repulsion between excited atom (Rydberg e-) and surrounding atoms in the ground state forms bubble Microscopic void around the excited atom 3s Similar to « e- bubble »
New autocorrelationfunction with « bath » interaction Atomic bubble He*(3s) Bulk helium Difference pair potential between the states corresponding to the emission line Molpro code Liquid density in the electronic ground state around 3s calculated using Bosonic Density Functional Theory DFT
Liquiddensityaround He*(3s3S) Liquid density around 3s3S calculated using DFT Phys. Rev. A 85 042706 (2012). Bubble Radius (Rb) depends on appliedpressure (P). 1 bar 3S Empty cavity around excited atom (emitter)
706.5 nm He* line (3S-3P) Experimental (continuous) vs theoretical (dashed) the line position is extremely sensitive to the He*(3s) - He pair potential Line shift
Mobility in supercritical He supercritical liquid Electron Mobility Gas Delocalized electron P>0.7 MPa « Electron bubble » Localized electron Electron self-trapping The He atoms are increasingly excluded from the localization center e- Smoother density profile
Supercritical He 706 nm line (3S-3P) at 14 K T=100 K Blue satellite P> 0,7 MPa P>0.7 MPa Excited atom He*(3s) Self-trapping???? Density profile DFT
Spectral parameters for the 706 nm line Same slope Gas T=300 and 150 K
He*-He ab initio potential energies for the triplet 3s He* (3s) and He atoms cannot approach with each other on distance less than penetration of depth (Temperature). liquid hump Penetration depth ~9.5 Å 14 K =10 cm-1 average thermal energy of ground state He atoms Mean distance He-He 6 bar ~1 bar 6.7Å
supercritical liquid 3s 3s P 3s 3s 3s 3s
Excimer He2* in Liquid Helium He2(d3Su+-b3Pg) Pressure P(18) High degree of rotational excitation No boltzmann distribution Strongly Blue Shifted Bubble
Gas and liquid He at 4.6 K He2(d3Su+-b3Pg) T rot= 80 K
Gas and liquid He at 4.6 K He2(d3Su+-b3Pg) Dense gas P=0.135 MPa Bulk liquid P=0.15 MPa High rotational excitation Non boltzmann distribution Gas P= 0.07MPa He2*(d3Su+) Self-trapping????
Rotational band shift different slope 4.6 K 14 K 300K
He2*(d3Su)-He ab initio potential Low accuracy hump Curvature ? J. Eloranta and V. A. Apkarian J. Chem. Phys. 115, 752 (2001).
Conclusions High Mobility (4.6 -14 K) T ~80-100 K Low Mobility He2(d3Su+ + Future work: He2*(d3Su)-He ab initio potential
He2(d3Su+-b3Pg) The density distribution in the rotational levels obeys the boltzmann distribution Trot~80 K
He*(33S)+He Uupper « hump » He*(33S) 706.5 nm He*(23P)+He Ulower He*(23P) 5Å R Inter-nuclear distance. He*-He ab initio Potential Molpro code Energy barrier can stabilize He* against the formation of He2*
Discharge in helium gas at 300 K Nplasma and Tkinetic at T = 300 K Ionization zone Transport zone N T= 300 K Broadening of He line 706 nm Broadening Ha Hb N2, N2+,He2 T N Discharge? NPlasma~ N Ne 1015-1016cm-3 Tkinetic~ 300-380K
Conclusions T<14K and N>1021cm-3 By analyzing the spectra obtained under various experimental conditions, we established that at above critical densities the excited He(3s) are localized in microscopic cavities similar to the localization of excess electrons. Inhomogeneous structure The interaction of the emitting species with the immediate surroundings causes remarkable changes in emission spectra in the micro-discharge. It makes emission spectroscopy a powerful tool for characterizing the low temperature plasma. LHe or Supercritical He N>1021cm-3
Excimer He2* T=4-14K N > 1021cm-3 c3Sg+–a3Su+ system of He2 P(1) line is significantly brighter than the other rotational lines P(3) and P(5) Thus, there appears to be two different rotational distributions simultaneausly present in the c3Sg+ population : -One for upper level K’=0 Trot=4,2 K-14 K -And the other for higher values of K’ Trot=100 K Two different zones Inhomogeneous structure
Excimer He2** T= 6-14 K N < 1021cm-3 c3Sg+–a3Su+ system of He2 Anomalous rotational distribution The upper level K’=18 is the most heavily populated rotational level
Excimer He2* Molecular rotation spectra c3Sg+–a3Su+ system of He2 T=4,2K T=6-14 K and P N>1021cm-3 T=6-14K and P N<1021cm-3
Excimer He2* c3Sg+–a3Su+ system of He2 T= 6-14 K N < 1021cm-3 POPULATION OF UPPER LEVEL Tr Boltzmann’s plot The models usually presented to explain the origin of the highly rotationally excited states involve ion He3+ - e- recombination Absorption k’’<< (metastable) open question?
at 4.2 K Excimer He2* He2(d3Su+-b3Pg) Tr=700K Discrepancy between the rotational temperature of He2(d3Su+-b3Pg) Tkinetic
Excimer He2* Schematic representation of the energy levels and allowed transitions in the helium triplet c3Σ+g- a3Σ+u system Upper level P(3) P(1) R(1) Lower level
4,2 K – 14 K (P>6 bar) 706 line Quasistatic line broadening theory ? Atomic Bubble model ? Gaussian Profile Gaussian profile
Theoreticalconsiderations : Molecular bands wavelength Te: electronic term, G(v): vibrational term, Fv(J): rotational term J rotational quantum number He2 Intensity of rotational lines branch Determination of rotational temperature Tr Translationaltemperature