Download
1 / 9
90 likes | 162 Vues
Explore the intricate structures and emission processes of supernova remnants. Learn about filaments, plerionic composite SNRs, radio and X-ray emissions, and the evolution of these cosmic phenomena.

E N D
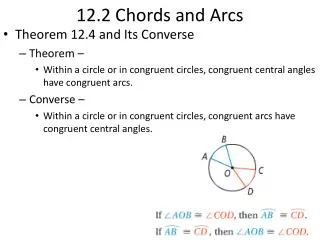
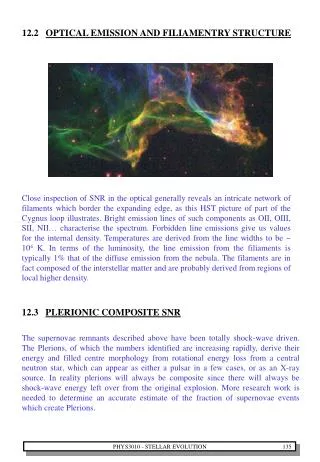
12.2 OPTICAL EMISSION AND FILIAMENTRY STRUCTURE Close inspection of SNR in the optical generally reveals an intricate network of filaments which border the expanding edge, as this HST picture of part of the Cygnus loop illustrates. Bright emission lines of such components as OII, OIII, SII, NII… characterise the spectrum. Forbidden line emissions give us values for the internal density. Temperatures are derived from the line widths to be ~ 104 K. In terms of the luminosity, the line emission from the filiaments is typically 1% that of the diffuse emission from the nebula. The filaments are in fact composed of the interstellar matter and are probably derived from regions of local higher density. 12.3 PLERIONIC COMPOSITE SNR The supernovae remnants described above have been totally shock-wave driven. The Plerions, of which the numbers identified are increasing rapidly, derive their energy and filled centre morphology from rotational energy loss from a central neutron star, which can appear as either a pulsar in a few cases, or as an X-ray source. In reality plerions will always be composite since there will always be shock-wave energy left over from the original explosion. More research work is needed to determine an accurate estimate of the fraction of supernovae events which create Plerions. PHYS3010 - STELLAR EVOLUTION
10-21 Power law a Fn W m-2 Hz-1 10-22 10-23 102 103 104 n MHz 12.4 RADIO EMISSION FROM SNR Supernovae remnants are generally found to be powerful radio sources having a power law spectral emission Fn = Kn-a with a having values in the range 0.5 to 0.8. This is a strong indication that the underlying emission mechanism is due to synchrotron radiation, a factor further reinforced by the observed polarisation of the radio waves. If the radiation is due to the synchrotron mechanism, the remnant must contain • Energetic electrons with a spectrum N(e) = K E-g dE, where g = 2a + 1 and will be in the rangeg = 2 --> 3 • A magnetic field which can be assessed to be in the range, B ~ 10-8 to 10-9 Tesla The observational radio data may be used to both improve our understanding of the physical conditions within the supernova remnant as well as learn something about the age and energetics of the original supernova explosion. For example we may readily estimate the energy of the electrons which are responsible for the radio emission. We showed earlier that so that if nm = 1010 Hz (radio), and B ~ 3 10-9 Tesla, then the energies of the electrons will be typically ~ 1014 eV. In this context it should be noted that, whilst the frequency of the radio photons is measured directly, the value of the magnetic field has to be inferred from either indirect measurement or be based upon other considerations. PHYS3010 - STELLAR EVOLUTION
Ne is the number of electrons Ee is the mean electron energy SECULAR DECREASE IN FLUX AND INTENSITY OF SNR Since supernovae remnants are expanding systems, it should be possible to understand the physics which govern the radio flux The relationships for synchrotron emission are as follows : The Synchotron spectrum is where n = frequency and B is the magnetic field If Conservation of Magnetic Flux in the Nebula gives where R is the radius of the nebula Adiabatic Expansion of the Nebula If the energy contained in the electrons is where { The energy contained in the magnetic field is PHYS3010 - STELLAR EVOLUTION
Thus under expansion we have Thus Since B 1/R2 Integrating gives EXPANSION OF YOUNG SNR 1993J Constant Number of Electrons New constants After substitution for E a 1/R So that the amplitude of the electron spectrum within the nebula is Note: I have not bothered to work out the detailed numerical values for the constants PHYS3010 - STELLAR EVOLUTION
Substitution for K and B gives which becomes, that after substitution for g = 2a + 1 Since the system is continually expanding we would expect the flux to decrease With a = 0.7 AGE OF A SUPERNOVA REMNANT FROM THE RADIO DATA CASSIOPEIA This supernova took place in ~ 1658 and has not started to decelerate, so that Thus Differentiating and dividing we get where T is the age of the SNR in years For Cassiopeia a = 0.8and Radio Image of Cas A PHYS3010 - STELLAR EVOLUTION
Mass of proton 12.5 X-RAY EMISSION FROM SUPERNOVAE REMNANTS ROSAT X-ray Images of Cas A (left) and the Vela (right) supernovae remnants Many of the SNR emit soft (1 - 10 keV) X-radiation. The plerions often are associated with strong non-thermal X-ray sources whereas the shock driven SNR generally have thermal emission spectra. In the latter case the location of the X-ray emission is generally associated with the shock front interaction with the interstellar medium, and is due to the heating effect. We can check if it is ultimately derived from the energy E0 of the initial explosion, assuming the SNR is in phase 2. R Temperature Now Total number of Particles (H atoms) EXOSAT Image of Tycho’s SNR PHYS3010 - STELLAR EVOLUTION
From our discussion relating to the phase 2 evolution of SNR we obtained 0K Thus giving NOTE that the temperature will decrease with time. The Veil Nebula in Cygnus If E0 ~ 1043 Joules, r0 ~10-21 kg m-3, and the age is t ~ 50,000 years Substitution gives T ~ 107 K and at kT ~ 0.7 keV we have thermal X-ray emission PHYS3010 - STELLAR EVOLUTION
i.e 1156 keV 68 and 78 keV Yield = 10-2 M0 10-3 CAS A (II) SN 1987 A TYCHO (I) Flux ph cm-2 s-1 10-5 KEPLER (I) 10-7 Yield = 2 10-5 M0 200 400 600 Age ~ 7 undiscovered Galactic Supernovae 12.6 HIDDEN HISTORICAL SNR AND GAMMA-RAYS The 44Ti decay chain results in the main g-ray line emissions The 44Ti has a mean life of about 68 years so that any of these nuclei synthesised within a supernova explosion will radiate the characteristic g-ray lines over a period of some hundreds of years. The flux at the Earth from a supernova of age t and distance RSNwill be Witht ~ 68 years and assuming ~ 10-4 M0 of 44Ti is synthesised per supernova explosion, the flux of g-ray lines at the Earth will be It is very likely that a number of historic supernovae will be discovered through “hot spots” of 44Ti g-ray emission along the galactic plane. The figure shows the expected line fluxes from a fixed distance of 10 kpc, with that expect from some known historic SN assuming yields of 44Ti in the range 10-4 - 10-2 M0. NOTE the CGRO instrument COMPTEL has measured a 1156 keV g-ray line flux of ~ 7.0 10-5 Photons cm-2 s-1 PHYS3010 - STELLAR EVOLUTION
a ~ 0.3 10-23 Radio a ~ 0.9 Fn W m-2 Hz-1 10-25 Optical a ~ 1.2 10-27 X-rays a ~ 1.2 10-29 g-rays 109 1011 1013 1015 1017 1019 n (Hz) 13. THE CRAB NEBULA The date of the original explosion is well known. It took place on July 4th 1054 and was recorded by Chinese astronomers who noted that they could see it at daytime, they also made some comments on its colour. It has proved to be an important object for astrophysics, we will look at some of the reasons. 13.1 THE SPECTRAL EMISSION The spectral emission follows a power law distribution all the way from radio right through to the high energy g-ray domain, albeit with a progressively steepening slope. The most likely mechanism has to be synchrotron radiation. As a direct consequence there must be both a magnetic field and electron fluxes within the nebula. The electrons must have sufficient energies to generate > 100 MeV g-rays (> 1024 Hz). The region from which the continuum emission arises is called the Amorphous Mass. PHYS3010 - STELLAR EVOLUTION