EDUCATIONAL STATISTICS
EDUCATIONAL STATISTICS. - EDU 5950 -. ABOUT THE INSTRUCTOR ASSOC. PROF. DR. ROHANI AHMAD TARMIZI. Email: rht@upm.edu.my rohaniat@gmail.com Tel: 89467005/0123100675.

EDUCATIONAL STATISTICS
E N D
Presentation Transcript
EDUCATIONAL STATISTICS - EDU 5950 - Rohani Ahmad Tarmizi - EDU5950
ABOUT THE INSTRUCTORASSOC. PROF. DR. ROHANI AHMAD TARMIZI Email: rht@upm.edu.my rohaniat@gmail.com Tel: 89467005/0123100675 Rohani Ahmad Tarmizi - EDU5950
Course Objective:Students will be able to acquire statistical concepts and statistical methods in data analysis for social sciences research.Students will be able to use statistical procedures for describing and interpreting social science research results. Rohani Ahmad Tarmizi - EDU5950
Course Content: Rohani Ahmad Tarmizi - EDU5950 4
Course Evaluation: Rohani Ahmad Tarmizi - EDU5950
Imust say that doing well in this course may require hard work! YOU CAN DO IT!!! Rohani Ahmad Tarmizi - EDU5950
What is Research? • SYSTEMATIC AND SCIENTIFIC INVESTIGATION in which the researchers want to • OBJECTIVES TO BE ACHIEVED • OBTAIN ANSWERS TO RESEARCH QUESTIONS, • GET HYPOTHESES TO BE TESTED AND VALIDATED • HENCE • The researcher collects data • The researcher indicates how the data answered the question OR validate the hypotheses through STATISTICAL ANALYSES. Rohani Ahmad Tarmizi - EDU5950
EXAMPLES OF RESEARCH TOPICS • Effects of Graphic Calculator on Performance and Mathematical Thinking Among Malaysian Mathematics Secondary School Learners • Relationship Between Perceived Organizational Support, Leadership Style and Job Satisfaction • Affective Commitment to the Organization and Job Satisfaction • Influences of Leadership Styles on Employee Performance • Transformational Leadership’s Impact on Higher Education Performance Rohani Ahmad Tarmizi - EDU5950
Importance of Research • Reason 1: Research Adds Knowledge About Educational Issues • Addresses gaps in knowledge • Expands knowledge • Adds voices of individuals to knowledge Rohani Ahmad Tarmizi - EDU5950
Importance of Research • Reason 2: Research Helps Improve Practice • Educators gain new ideas • Educators gain new insight into methods • Educators gain new insight into students Rohani Ahmad Tarmizi - EDU5950
Importance of Research • Reason 3: Research Informs Policy Debates • Research helps people weigh different perspectives on issues • Research helps people make informed decisions regarding policy Rohani Ahmad Tarmizi - EDU5950
Importance of Research • Reason 4: Research Builds Student Research Skills • Organizational skills • Analytical skills • Writing skills • Presentation skills Rohani Ahmad Tarmizi - EDU5950
Identify the Research Problem Review the Literature Analyze and Interpret Data Specify a Research Purpose Collect Data The Research Spiral Specify a problem Justify a problem Suggest a need to study it for audiences Write Report Select and summarize the resources in a Literature Review Determine the data collection method, Select the individuals to study, Design instruments, and outline procedures Rohani Ahmad Tarmizi - EDU5950
Curiosity to solve puzzles Lengthen attention span Using the library and computer resources Writing and rewriting Skills Needed for Research
TYPES OF RESEARCH • QUANTITATIVE RESEARCH • QUALITATIVE RESEARCH
Quantitative Research ♠ Are used in the systematic scientific investigation of quantitative properties and phenomena and their relationships. ♠ Are widely used in both the natural and social sciences, from physics and biology to sociology and journalism. ♠ The objective is to develop and employ mathematical models, theories and hypotheses pertaining to natural phenomena ♠ The process of measurement is central to quantitative research because it provides the fundamental connection between empirical observation and mathematical expression of quantitative relationships. Rohani Ahmad Tarmizi - EDU5950
Quantitative methods ♠ Are research methods dealing with numbers and anything that is measurable. ♠ Counting and measuring are common forms of quantitative methods. ♠ The modern tendency is to use statistical softwares to analyze the huge amount of data. Quantitative methods might be used with a global qualitative frame ♠ Using quantitative methods, it is possible to give precise and testable expression to qualitative ideas. Rohani Ahmad Tarmizi - EDU5950
Qualitative methods ♠ Are research methods dealing with natural settings to gather direct source of data for example in schools, community, company, etc ♠ The researcher is the key instrument who will be directly observing and interviewing individuals as people go about their daily routines. ♠ The data comes in the form of words, video recordings, documents, manuscripts, or pictures rather than numbers. ♠ Qualitative researchers are concerned with context, process as well as product. Their concerns – how things occur, how people’s attitudes are translated into actions, gestures, teacher’s mannerism, views, opinions, etc. Rohani Ahmad Tarmizi - EDU5950
Basic Statistical Concepts Rohani Ahmad Tarmizi - EDU5950
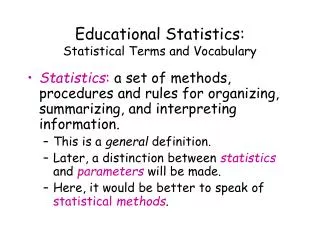
What is Statistics? Statistics is the science of collecting, organizing, analyzing, and interpreting data in order to make decisions. Rohani Ahmad Tarmizi - EDU5950 20
Branches of Statistics • Descriptive StatisticsInvolves organizing, summarizing, and displaying data. • Inferential StatisticsInvolves using sampledata to draw conclusions about a population. Rohani Ahmad Tarmizi - EDU5950 21
x x x x x x x x x x x x x x x x x x x x x x x x x x x x x x x x x x x x x x x x x x x x x x x x x x x x x x x x x x x x x x x x x x x x x x x x x x x x x x x x x x Important Terms • Population The collection ofall responses, measurements, or counts that are of interest. • Sample A portion or subset of the population. x x Rohani Ahmad Tarmizi - EDU5950 22
Important Terms • Parameter: A number that describes a population characteristic. Average age of all people in the United States • Statistic: A number that describes asample characteristic. Average age of people from a sample of three states. Rohani Ahmad Tarmizi - EDU5950 23
x x x x x x x x x x x x x x x x x x x x x x x x x x x x x x x x x x x x x x x x x x x x x x x x x x x x x x x x x x x x x x x x x x x x x x x x x x x x x x x x x x x x x x x x x x x x x x x x x x x x x x x x x x x x x Random Samples Simple Random Sample: Each member of the population has an equal chance of being selected. • Assign a number to each member of the population. • Random numbers can be generated by a random • number table, a software program or a calculator. • Members of the population that correspond to these numbers become members of the sample. • From the sample we obtain measurements -> variables or constructs Rohani Ahmad Tarmizi - EDU5950 24
1st place Levels of Measurement 1. Nominal: Categories, names, labels, or qualities. Cannot perform mathematical operations on this data. Ex:type of car you drive, your major 2. Ordinal: Data can be arranged in order. You can say one data entry is greater than another. Ex:TV ratings, condition of patient in hospital. Rohani Ahmad Tarmizi - EDU5950 25
Levels of Measurement Data can be ordered and differences between 2 entries can be calculated. There is no inherent zero (a zero that means “none”.) 3. Interval: Ex: IQ, EQ, life satisfaction, marital happiness There is an inherent zero. Data can be ordered, differences can be found, and a ratio can be formed so you can say one data value is a multiple of another. 4. Ratio: Ex.Height, weight, age Rohani Ahmad Tarmizi - EDU5950 26
Statistic Can be viewed in two perspective: ► Numerical facts ► A fields discipline study Decision making tools Types of statistics ► Purpose Descriptive vs Inferential ►Assumption Parametric vs Non parametric ►Number of variables Univariate – Bivariate – Multivariate Rohani Ahmad Tarmizi - EDU5950
VariablesCharacteristic studied that assume different values for different elements Demography: ► Gender ► Job tenure ► Occupational status Job characteristic: ► Work condition ► Job demand ► Job control Quality of work life Perceived quality of ICT facilities Dependent Variable Independent Variables Rohani Ahmad Tarmizi - EDU5950
Sales of Measurement Nominal ► The lowest scale ► Numbers assigned to identify attributes ► No order/ sequence Ordinal ► Numbers assign in ranking order ► Arrange from lowest to highest or vice versa Interval ► Arbitrary zero (no absolute zero) ► Zero does not represents absence of the characteristic Ratio ► The highest scale ► True zero (represent absence of the characteristic) Rohani Ahmad Tarmizi - EDU5950
Exercise: What are the scales of measurement for these variables? Program of study Speed (km/hr) Motivation scores Income categories Number of SMS received Marital Status Quality of work life scores Socio-economic status Perception scores Membership status Rohani Ahmad Tarmizi - EDU5950
Statistic Analyses and Scales of Measurement StatisticDependent VariablesIndependent Variables t-Test Interval / Ratio Nominal / Ordinal (k=2) ANOVA Interval / Ratio Nominal / Ordinal (k>2) Chi-square Nominal / Ordinal Nominal / Ordinal Spearman Rho Ordinal Ordinal Interval / Ratio (Non-Normal) Interval / Ratio (Non-Normal) Pearson correlation Interval / Ratio Interval / Ratio Simple Linear Regression Interval / Ratio Interval / Ratio (At least one of the scales is Nominal) OR Rohani Ahmad Tarmizi - EDU5950
DOING RESEARCH MEANS YOU NEED DATA • Data – organized information when researcher has undergone data collection phase • Data can be organized and stored in various ways – softcopy/hardcopy, excell/spss/minitab/sas, etc Rohani Ahmad Tarmizi - EDU5950
SAMPLE OF DATA Rohani Ahmad Tarmizi - EDU5950
DATA - Aron, Paris and Aron (1995) study on 151 students on a question “How stressed have you been in the last 2 weeks, on a scale of 0 to 10, with 0 being not at all stressed and 10 being as stressed as possible” 4,7,7,7,8,8,7,8,9,4,,7,3,6,9,10,5,7,10,6,8,7,8,7,8,7,4,5,10,10,0,9,8,7,9,7,9,5,8,5,0,4,6,6,7,5,3,2,8,5,10,9,10,6,4,8,8,8,4,8,7,3,8,8,8,8,7,9,7,5,6,3,4,8,7,5,7,3,3,6,5,7,5,7,8,8,7,10,5,4,3,7,6,3,9,7,8,5,7,9,9,3,1,8,6,6,4,8,5,10,4,8,10,5,5,4,9,4,7,7,7,6,6,4,4,4,9,7,10,4,7,5,10,7,9,2,7,5,9,10,3,7,2,5,9,8,10,10,6,8,3. Rohani Ahmad Tarmizi - EDU5950
Types of Variables VARIABLES – are the focus of a study or the things that we measure in a study/research ♠ Continuous vs Discrete ► anxiety level – continuous ► anxiety categories – low or high ♠ Independent variable vs Dependent variable ► variable manipulated by the researcher to investigate its effect (teaching approach, medication, counseling therapy, training modules) ► variables that are characteristic/inherent which the researcher wish to investigate (race, gender, program of studies) ► variable assumed dependent upon the value of independent variable. by the researcher to investigate its effect (achievement, sugar level, depression level, physical fitness) ► length, weight, speed, exam marks etc. Rohani Ahmad Tarmizi - EDU5950
Branches of Statistics • Descriptive StatisticsInvolves organizing, summarizing, and displaying data. • Inferential StatisticsInvolves using sampledata to draw conclusions about a population. Rohani Ahmad Tarmizi - EDU5950
MAJOR PURPOSE OF DESCRIPTIVE STATISTICS Rohani Ahmad Tarmizi - EDU5950
MAJOR PURPOSE OF INFERENTIAL STATISTICS TO COMPARE BETWEEN GROUPS ► z-Test ► t-Test – Independent or Dependent t-test ► F-Test – Analysis of Variance TO DETERMINE RELATIONSHIP Variables ► Pearson correlation ► Spearman correlation ► Point Biserial correlation ► Simple linear regression ► Chi-square Rohani Ahmad Tarmizi - EDU5950