Download

1 / 12
140 likes | 451 Vues
CHEMICAL TRACERS, INC. C. T. I. Single Well Chemical Tracer Testing Services. www.chemtracers.com. Chemical Partitioning (Connate Water Saturation Testing). Chemical Partitioning of Tracer i between Phases. OIL. WATER.

E N D
CHEMICAL TRACERS, INC. C T I Single Well Chemical Tracer Testing Services www.chemtracers.com
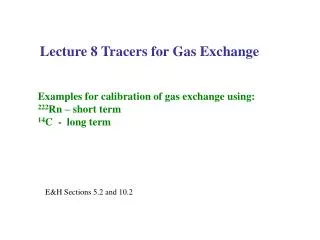
Chemical Partitioning (Connate Water Saturation Testing) Chemical Partitioning of Tracer i between Phases OIL WATER Visual of chemical partitioning concept. Red is an alcohol tracer such as iso-propyl alcohol, K=6 to 9. Blue represents a ester tracer such as iso-propyl acetate K= 0.1 to 0.5. K decreases with temperature and connate water salinity. Ci (Water) Ki= at Equilibrium Ci (Oil)
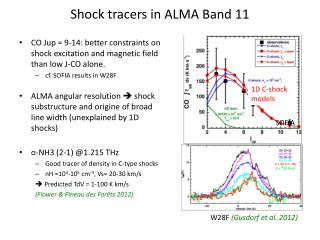
So Single Well Chemical Tracer Test For Connate Water Saturation Base slide showing well/test zone profile. Blue is water, green is oil. In this case, the oil in the pore space is all pushed to the base of the zone to help illustrate the operation of a SWCT test. The well perforations are shown as the white broken line. In a connate water test setting, the water is stationary in the pore space and the oil is the mobile phase. The well produces 100% oil. Swc
Swc So Step 1 Ester Injection The ester is injected at about 50,000 ppm concentration in oil or diesel. Since the ester partition coefficient is measured in the laboratory before the test using produced water and test reservoir oil. For this example, the ester K value is 0.1. This means that the ester, iso-propyl acetate, is five times more soluble in the oil than it is in the water. As a test example we will illustrate a 1000 bbl SWCT test for connate water saturation. The first 250 bbls of injected oil will carry the iso-propyl acetate, into the reservoir. As soon as the ester enters the pore space containing connate water, the ester partitions slightly into the stationary connate water according to the partition coefficient K. The black dots represent this ester. The green represents the injected oil. The ester travels at almost the same speed as the injected oil. The ester spends most of the time in the mobile oil phase.
Swc So Step 2 Ester Push The first 250 bbls of oil with iso-propyl acetate is followed with a 750 bbl oil injection to push the ester bank away from the well about 15 to 20 feet. All the injection oil is tagged with a material balance tracer such as methyl iso-butyl ketone (MIBK). The ester tracer stays together as a donut shaped bank and is continuously in equilibrium with both the oil and water phases. This injection usually is completed in one to two days. Injected Oil or Diesel Ester Tracer
Swc So Step 3 Shut-In (Reaction) Period IPAc + H2O IPOH + HAc The well is then shut in for from 2 to 10 days according to reservoir temperature. In this example case the injection took place in one day and the shut in period is four days. During this shut in period, about 30% of the iso-propyl acetate is converted to iso-propyl alcohol via a reaction with water. Acetic acid is also formed which immediately reacts with base carbonate cementing material to form water and an acetate salt such as calcium acetate. The red dots represent the new tracer, iso-propyl alcohol, formed in-situ. The new iso-propyl alcohol product tracer has a K value of about 8 (eight times more soluble in the water than the oil phase.
Swc So Step 4 Production Period The well is then produced via rod pump, gas lift, ESP or free flow. When production starts the new tracer iso-propyl alcohol moves slowly back to the well because partitioning into the stationary connate water phase slows it’s velocity relative to the flowing oil phase. The un-reacted ester on the other hand produces back to the well at essentially the same velocity as the flowing oil phase. The white arrows are an attempt to point out the different velocities of the iso-propyl alcohol and un-reacted iso-propyl acetate flowing back to the well. Separation occurs between these two tracers during the flow-back step. The separation is a function of the product alcohol, iso-propyl alcohol K-value and the connate water saturation. Samples of produced fluid are taken on the surface each five to 20 minutes and immediately analyzed on location via gas chromatography for tracer content.
Swc So Step 4 Production Period (Continued) As production continues, the separation between the iso-propyl alcohol tracer, red, and iso-propyl acetate tracer continues to increase reflecting the ratio of oil to water encountered in the pore space.
Swc So Step 4 Production Period (Continued) The ester tracer, iso-propyl acetate arrives at the surface before the product tracer, iso-propyl alcohol. In a case where there is no connate water in the pore space (hypothetical), the iso-propyl alcohol and iso-propyl acetate tracers will arrive at the well-bore simultaneously.
Swc So Step 4 Production Period (Continued) Interestingly, the injected oil front and the injected iso-propyl acetate leading edge superimpose as the injected oil front reaches the well bore. Of course this illustration shows no dispersion to simplify visualization of the test process.
Swc So Step 4 Production Period (Continued) Sampling and analysis of the produced oil continues throughout the production period until the injected oil is recovered. This usually takes from two to four days.
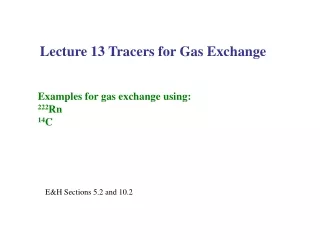
Each sample taken is identified with the total volume of oil produced when the sample is taken. These two field measured data are combined in this production profile to show tracer arrival at the surface. Each point on the profile represents the analytical results of one sample. The ester tracer predictably arrives after 750 bbls of production. Dispersion, or mixing in the pore space smoothes out the square edges of each profile. The alcohol arrival volume relative to the ester arrival volume combined with the alcohol’s K value is the source of Swc. The material balance tracer (MIBK) returns at the injected concentration, 1800 ppm and has a total area of 1,800,000 bbl-ppm showing a 100% material balance. Un-reacted Ester Tracer Product Alcohol Tracer Concentration Tracers (ppm) Concentration Tracers (ppm) Volume Produced (bbls) Single Well Chemical Tracer Test Production Profile