Download
1 / 51
530 likes | 874 Vues
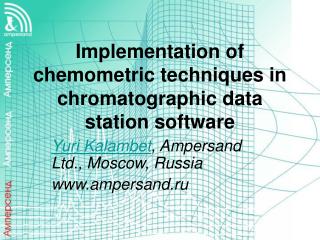
Implementation of chemometric techniques in chromatographic data station software. Yuri Kalambet , Ampersand Ltd., Moscow, Russia www.ampersand.ru. Data processing. Noise level estimation Noise filtration and/or data bunching Peak search Peak quantification (area, height, asymmetry, etc.)

E N D
Implementation of chemometric techniques in chromatographic data station software Yuri Kalambet, Ampersand Ltd., Moscow, Russia www.ampersand.ru
Data processing • Noise level estimation • Noise filtration and/or data bunching • Peak search • Peak quantification (area, height, asymmetry, etc.) • Table of components (qualitative analysis) • Calibration graph (quantitative analysis) • Peak shape analysis and deconvolution • Periodic noise filtration • Multichannel (spectral) data analysis
Noise • High-frequency noise estimation using the whole time series data set • Noise filtration could cause questions from GLP rules • Bunching never causes questions from GLP, but can significantly reduce observed noise • Noise is taken into account while: • peak detection; • approximation quality evaluation • multichannel/spectral analysis
Peak Quantification • Baseline Y position using weighted Savitsky-Goley approximation with evaluation of approximation quality • Primary peak parameters using adaptive polynomial approximation, where parameters of polynomial depend on target peak width and asymmetry • Criterion for algorithm selection: Peak parameters should be resistant to bunching operation
Noise definition • 1st derivative point DOES NOT belong to “noise pool of points” if both of the neighboring derivative points have the same sign • 1st derivative point DOES NOTbelong to “noise pool of points” if its absolute value is outside 5 sigma of absolute values distribution (iterative procedure)
Calibration Predictive relationship between input and detector response • Input: calibration samples – concentrations of components • Output: peak area or height • Prediction: Predict unknown input looking at response
ESTD Calibration • Response (Area or Height) versus Quantity • Quantity is provided without error - false • Response is measured with random normally distributed error – sometimes true
Calibration Curve • Axes: Q – Quantity (NOT Concentration), R – Response (Area or Height) • Independent variable: Typically Q, sometimes R • Calibration curve: polynomial interpolation • Prediction: either solution of polynomial equation (independent Q) or value of polynomial (independent R) – we denote either of them W(R)
QuantificationAbsolute Concentration • Quantity of injected substance Qx = W(Rx) • Concentration of initial sample Cx = Qx/V = W(Rx)/(Vinj*A/D) • Vinj – injection volume • A – amount • D – dilution
ISTD Targets Reason Axis • Sample-size variations Q • Effect of sample preparations Q • Instrument drift R All reasons are acting always together
ISTD tricks • Add component with known concentration to sample • Add component with known concentration to calibration samples Usually it’s done together, but who told that you can’t do it separately?
ISTD with ESTD calibration = Relative Concentration • Accounts for systematic error due to sample-size error and sample losses while preparation. • Assumption: volume is unknown and is calculated using known concentration of the internal standard V = Qxistd/Cxistd = Wistd(Rxistd)/Cxistd, • Qxistd is calculated using calibration curve of Internal standard from Rxistd, Cxistd – declared concentration of standard in sample • Relative Concentration C = Qx/V = Cxistd×Wx(Rx)/ Wistd(Rxistd)
“Universal” ISTD Calibration • If calibration is nonlinear, we must measure this nonlinearity, i.e. we MUST know ESTD calibration curve of the Internal Standard component • In the case we learned this curve somehow, we can use this curve to change positions of calibration points of other components using the same trick as was used while calculating Relative Concentration: Qn = Cn×V = Cn×Wistd(Ristd)/Cistd • So, for Internal Standard predefined curve is in use, all other components get curves constructed conditionally, condition being known calibration curve of the Internal Standard component
Pro et Contra Advantages: • Only one type of axes • Calibration curves are suitable for calculation of both Absolute and Relative concentrations Disadvantages: • ESTD Calibration curve of Internal Standard is required
Qn = Cn×V = Cn×Wistd(Ristd)/Cistd • Multiplication of Q axis of Internal Standard to any number will multiply Q coordinates of all corrected points of all components to the same number, hence causing “affinity” change of all calibration curves. Calibration curve will change, absolute concentration also, but not Relative Concentration C = Cxistd×Wx(Rx)/ Wistd(Rxistd) • If all calibration dependencies are linear through origin Q = K×R, it is possible to select multiplication factor so, that Kistd = 1 and we will get relative response factors for all other components.
“Classic” ISTD • Calibration dependence in coordinates Response Ratio vs. Concentration ratio • Calibration curve: polynomial, typically straight line through origin • Prediction: from Response Ratio predict Concentration Ratio • Peculiarities: no calibration curve for Internal Standard component
Device Drift • Drift model: R = K×F(Q) • Drift can be compensated completely, if exists such k, that K×F(Q)=F(k×Q) • Particular case: linear through origin calibration; K = k
Conclusions • ISTD is split in two parts: ISTD quantification (Relative Concentration) and ISTD Calibration. Parts can be applied separately • Relative Concentration is applicable for both ESTD and “Universal” ISTD calibrations • Full “Universal” ISTD calibration can be used for both ESTD and ISTD calculations • Simplified “Universal” ISTD calibration can be used in the case of linear through origin calibrations instead of “Classic” ISTD calibration including imitation of user interface • Full “Universal” ISTD solution still works where “Classic” already fails, i.e. it allows to get into account wide concentration range of Internal Standard in the case of nonlinear calibrations
Difficulties • User mind. The more users are used to “Classic” ISTD method, the more difficult it is to change their minds. Typical argument: -“Old approach works. We typically use linear through origin calibrations. Why should we change the way how we work?”.
Peak deconvolution by shape Peak shape • Gaussian • Exponentially modified Gaussian • Corresponds to reference peak Tuning, specific to chromatography • Peak width • individual for every peak; • the same for all peaks • proportional to retention time • asymmetry of the same sign (2) Optimization criterion • quadratic(sum of squares of residuals) • weighted quadratic (weight = response)
EMG peak shape analysis Problems: product of zero to infinity for some range of parameters Solution: or “standard” Gaussian function, depending on parameter values
Fourier-domain periodic noise filtration • Median filter in Fourier space
Multichannel chromatogram questions • Which channel is better? • How to detect peaks? • How to identify peaks? • How to access substance purity?
Multichannel chromatogram answers • Calculated channels • Using weighted PCR: Noise-normalized detector response space for spectra comparison • Measure of difference for spectra: angle • “Local” spectrum quality: angle with neighbors • Factor analysis with missing (overloaded) points allowed • Qualitative and quantitative spectra comparison
Weighted PCA • Channel weighting • Point weighting
Calculated channels Summary. Types of Calculated channels: • Total • Average • Difference • Integral • Derivative - up to 3-rd order • Angle • «Response/Time» channel • Spectral ratio channel
Spectrum identification Step 1: Spectrum calculation.
Step 2: Performing recognition.
Step 3: Conflicts resolving.
Step 4: View and print report.
Calculated channels in “Chrom&Spec”. Summary. Types of Calculated channels: • Total • Average • Difference • Integral • Derivative - up to 3-rd order • Angle • «Response/Time» channel • Spectral ratio channel
Factor analysis example. Picture shows the “sum of s/n” channel of multi-channel chromatogram. Usual peak-detection procedure failed to resolve peaks. What about factor analysis?
Factor analysis. Step 1. Software makes PCR of the region selected and suggests number of components in the analyzed region (Rank). Overlapping only 2 peaks means that software does not look for overlapping of 1st and 3rd components, only 1st and 2nd and then 2nd and 3rd.
Factor analysis. Step 2 On the left panel we can choose any channel to view peak deconvolution results. Rotation is selected using “local purity” attribute, resulting in “Pure component” approach
Factor analysis. Step 3 The resolved peaks are displayed together with the original channel. The chromatogram with additional newly generated channels can be saved into separate file. Each generated channel represents the detector response, corresponded to particular component. When user finishes the wizard, the original peak is split in the proportions, corresponding to component’s fractions.