Chemometric functions in Excel
Chemometric functions in Excel. Oxana Rodionova & Alexey Pomerantsev Semenov Institute of Chemical Physics rcs@chph.ras.ru. Distance Learning Course in Chemometrics for Technological and Natural-Science Mastership Education. Unfulfilled need in chemometric education in Russia

Chemometric functions in Excel
E N D
Presentation Transcript
Chemometric functions in Excel Oxana Rodionova & Alexey Pomerantsev Semenov Institute of Chemical Physics rcs@chph.ras.ru
Distance Learning Course in Chemometrics for Technological and Natural-Science Mastership Education Unfulfilled need in chemometric education in Russia Low number of qualified specialists in chemometrics Large distances, e.g. Moscow – Barnaul is about 3000 km No modern chemometrics books in Russian No available chemometric software No support from officials: government, Academy, etc 3000 km Easy available everywhere => INTERNET Interactive layout: all calculations should be clear and repeatable Web friendly environment for the calculations => EXCEL Necessity to make and use our own (free) software => EXCEL Add-In 4000 km Barnaul
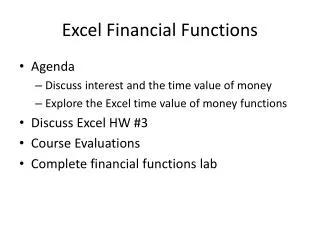
Chemometric calculations in Excel Provides user with all possibilities of Excel interface, worksheet calculations, worksheet functions, charts, etc. VBA helps to simplify routine work All calculations are made "on the fly“ and very fast
Installation http://rcs.chph.ras.ru/down/sacs.zip Chemometrics.dll put in your Windows folder (C:\WINDOWS\) Chemometrics. xla put in the AddInn folder (C:\Documents and Settings\ <User>\Application Data\ Microsoft\AddIns\) Load Chemometrics.xla by < Excel Options> <Add-Ins> in the open Workbook
B6:F10 Barr Matrix calculations in Excel ={TRANSPOSE(B6:F10)} Ctrl-Shift-Enter ={MMULT(B6:F10,TRANSPOSE(Barr))}
Scorematrix Error matrix PT X × A E T J + J I = I P A A J Principal Component Analysis (PCA) Initial data Loading matrix I J X=TPT+E
Xcal Xtst CenteringAND/ORweighting nPC Chemometrics XLA. PCA Scores ={ScoresPCA(Xcal,5,1,Xtst)}
Xcal CenteringAND/ORweighting nPC Excel worksheet function Chemometrics XLA. PCA Loadings =TRANSPOSE(LoadingsPCA(Xcal,5,1))}
List of chemometric functions PCA ScoresPCA <for calibration or test samples> LoadingsPCA PLS ScoresPLS <X-scores for calibration or test samples> UScoresPLS <Y-scores for calibration or test samples> LoadingsPLS <P-loadings> WLoadingsPLS QLoadingsPLS PLS2 ScoresPLS2 <X-scores for calibration or test samples> UScoresPLS2 <Y-scores for calibration or test samples> LoadingsPLS2 <P-loadings> WLoadingsPLS2 QLoadingsPLS2 Options: • Centering AND/OR scaling • Number of PCs
ScoresPCA X data (calibration set) ScoresPCA (rMatrix [, nPCs] [,nCentWeightX] [, rMatrixNew] ) Number of PC (A) Test set centering and/or scaling 1 centering 2 scaling 3 both X[IJ] T[I A]
Validation Rules If rMatrixNew is omitted then only calibration scores are calculated If rMatrixNew is specified then only test scores are calculated If rMatrixNew coincides with rMatrix then cross-validation is calculated 10% -out cross-validation
LoadingsPCA X data (calibration set) LoadingsPCA (rMatrix [, nPCs] [,nCentWeightX]) Number of PC (A) centering and/or scaling 1 centering 2 scaling 3 both X[IJ] P[J A]
Explorative Data Analysis Case study 1: People
Dataset in Excel Workbook (People.xls) Number of objects (n) = 32 Number of variables (m) =12
Data Preprocessing Aim: to transform the data into the most suitable form for data analysis
+ mean centering scaling = autoscaling Autoscaling
People: Scores & Loadings (PC1 vs. PC2) “Map of Samples” “Map of Variables”
People: Scores & Loadings (PC1 vs. PC3) Loading plot Score plot
Dataset in Excel Workbook X(3028)
Pure compoundsA andB If we observe X can we predict C and S? X=CST+E
A B Score plot
Conclusions from the Score Plot 1. Linear regions = Pure compounds2. Curved line= Co-elution3. Closer to the origin = Lower intensity4. Number of bends = Number of different compounds
J J X X I I ST PT = = A 2 J J T C × × I I + + E2 E1 Factor analysis vs. PCA analysis
Procrustes transformation X ≈ CST X ≈ TPT I = RRT = Identity matrix X ≈ T(RRT)PT = (TR)(PR)T C ≈ TR S ≈ PR R = Rstretch×Rrotation ^ ^
Stretching Rotation Scores Transformation
Conclusions • Scaling and centering is problem dependent • In this example number of PCs = Number of different compounds
Principal Component Regression (PCR) T ... P t t ... 1 A t p 1 T y e t p A a + = X 1) PCA 2) MLR
Projection on Latent Structures (PLS) T U ... ... u u 1 A Q P t t ... ... 1 A t t t t w p q q 1 1 1 A t t p w A A W ... X Y
e B = + Projection on Latent Structures (PLS) T Y
1 1 T y e 1 b = + M M T Y E M B = + PLS and PLS2 PLS PLS2
ScoresPLS X data (calibration set) Y data (calibration set) ScoresPLS (rMatrixX, rMatrixY[, nPCs] [, nCentWeightX] [, nCentWeightY] [, rMatrixXNew]) Number of PC (A) X Test set centering and/or scaling of X 1 centering 2 scaling 3 both centering and/or scaling of Y 1 centering 2 scaling 3 both X[IJ], Y[I1] T[IA]
UScoresPLS X data (calibration set) Y data (calibration set) UScoresPLS (rMatrixX, rMatrixY[, nPCs] [, nCentWeightX] [, nCentWeightY] [, rMatrixXNew] [, rMatrixYNew]) Number of PC (A) X Test set Y Test set centering and/or scaling of X 1 centering 2 scaling 3 both centering and/or scaling of Y 1 centering 2 scaling 3 both X[IJ] , Y[I1] U[I A]
WLoadingsPLS X data (calibration set) Y data (calibration set) WLoadingsPLS (rMatrixX, rMatrixY[, nPCs] [, nCentWeightX] [, nCentWeightY]) Number of PC (A) centering and/or scaling of X 1 centering 2 scaling 3 both centering and/or scaling of Y 1 centering 2 scaling 3 both X[IJ] , Y[I1] W[J A]
LoadingsPLS X data (calibration set) Y data (calibration set) LoadingsPLS (rMatrixX, rMatrixY[, nPCs] [, nCentWeightX] [, nCentWeightY]) Number of PC (A) centering and/or scaling of X 1 centering 2 scaling 3 both centering and/or scaling of Y 1 centering 2 scaling 3 both X[IJ] , Y[I1] P[JA]
QLoadingsPLS X data (calibration set) Y data (calibration set) QLoadingsPLS (rMatrixX, rMatrixY[, nPCs] [, nCentWeightX] [, nCentWeightY]) Number of PC (A) centering and/or scaling of X 1 centering 2 scaling 3 both centering and/or scaling of Y 1 centering 2 scaling 3 both X[IJ], Y[I1] Q[1 A]
ScoresPLS2 X data (calibration set) Y data (calibration set) ScoresPLS2 (rMatrixX, rMatrixY[, nPCs] [, nCentWeightX] [, nCentWeightY] [, rMatrixXNew]) Number of PC (A) X Test set centering and/or scaling of X 1 centering 2 scaling 3 both centering and/or scaling of Y 1 centering 2 scaling 3 both X[IJ], Y[IK] T[I A]
UScoresPLS2 X data (calibration set) Y data (calibration set) UScoresPLS2 (rMatrixX, rMatrixY[, nPCs] [, nCentWeightX] [, nCentWeightY] [, rMatrixXNew] [, rMatrixYNew]) Number of PC (A) X Test set Y Test set centering and/or scaling of X 1 centering 2 scaling 3 both centering and/or scaling of Y 1 centering 2 scaling 3 both X[IJ], Y[IK] U[I A]
WLoadingsPLS2 LoadingsPLS2 QLoadingsPLS2 X data (calibration set) Y data (calibration set) LoadingsPLS2 (rMatrixX, rMatrixY[, nPCs] [, nCentWeightX] [, nCentWeightY]) Number of PC (A) centering and/or scaling of X 1 centering 2 scaling 3 both centering and/or scaling of Y 1 centering 2 scaling 3 both X[IJ], Y[IK] P[J A] or W[J A] or Q[K A]
Seventh Winter Symposium on Chemometrics near Tula city, February 2010 100 km