
SlideServe
Menu
Préférences
© SlideServe · v2026

Useful EXCEL Functions

buffy-berg avatar
14 diapositives · 323 Views · Nov 03, 2014

Break-even analysis is essential for determining the service volume needed to ensure that revenue exceeds costs. This analysis is particularly applicable in healthcare, helping organizations understand the balance between total revenue and total costs. As service volume increases, revenue grows faster than total costs, indicating profitability. The basic linear model outlines how to calculate break-even points using total revenue, fixed costs, and variable costs. This guide covers solutions to common case problems, variations, and sensitivity analyses to enhance decision-making in healthcare finance.
Useful EXCEL Functions - slide 1
01 / 14Useful EXCEL Functions
1 / 17

Télécharger la présentation

Useful EXCEL Functions
Une image / un lien ci-dessous est fourni (tel quel) pour télécharger la présentation

Politique de téléchargement : le contenu du site vous est fourni TEL QUEL pour votre information et votre usage personnel ; il ne peut être vendu, concédé sous licence ni partagé sur d’autres sites sans l’accord de son auteur.Le contenu vous est fourni TEL QUEL, pour votre information et votre usage personnel uniquement. Téléchargez la présentation en cliquant sur ce lien. Lors du téléchargement, si vous ne parvenez pas à télécharger une présentation, l’éditeur a peut-être supprimé le fichier de son serveur.Pendant le téléchargement, si vous ne parvenez pas à obtenir une présentation, le fichier a peut-être été supprimé par l’éditeur.

F I N

Plus de contenu associé

Transcription de la présentation
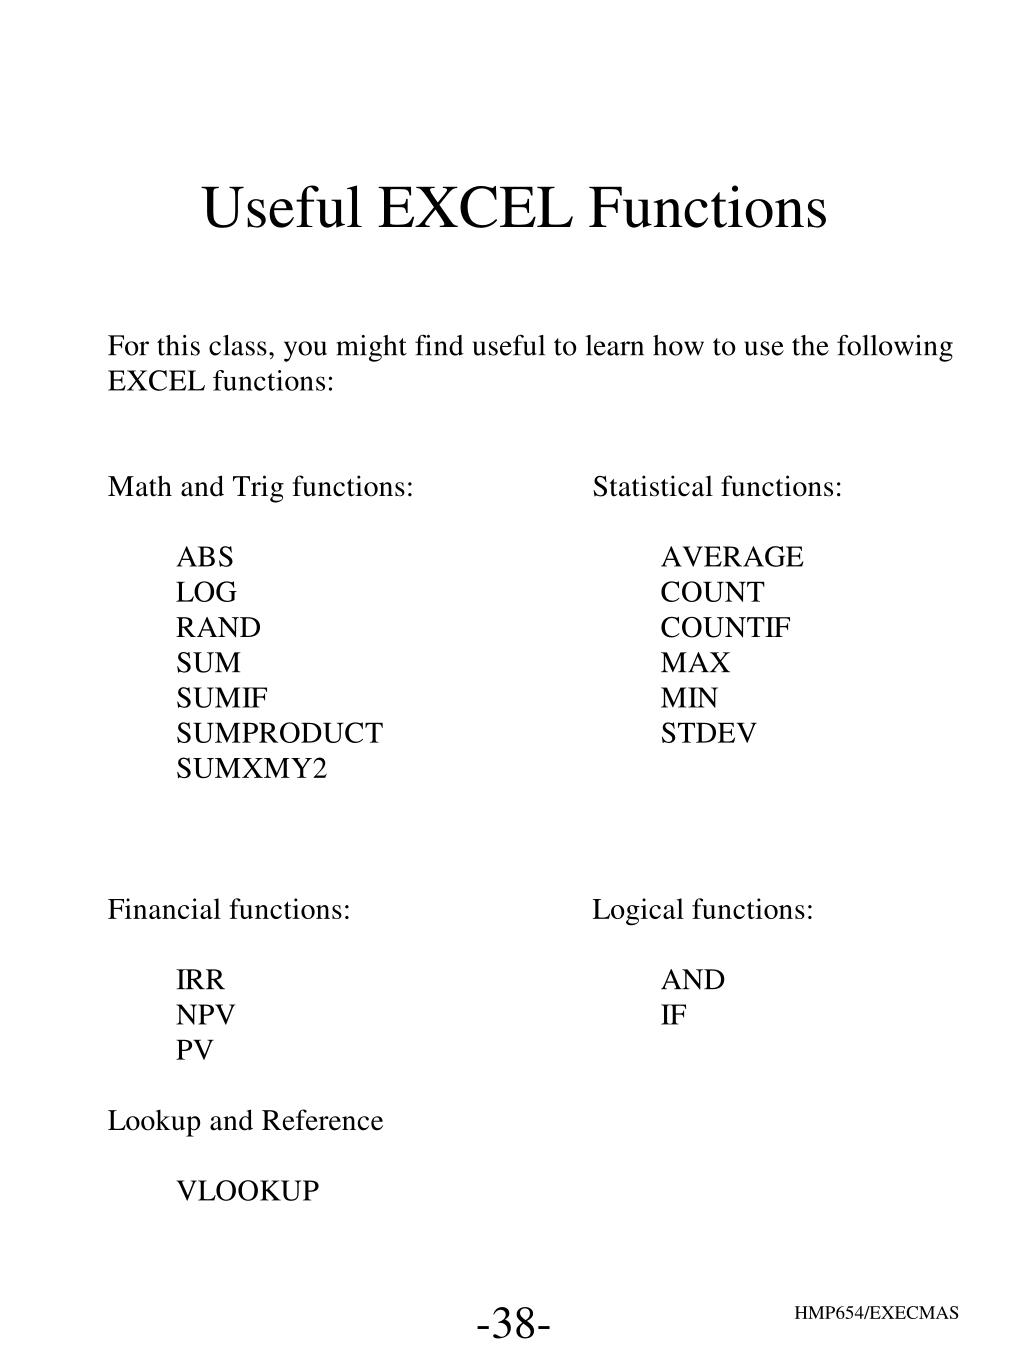
  1. Useful EXCEL Functions

  2. Break-Even Analysis • Break even analysis determines the volume of service needed to ensure that revenue generated will exceed costs. • Applications in health care • Basic Model • Revenue growths with increasing service volume • Total cost growths with increasing service volume but at a slower rate than revenue

  3. Break-Even Analysis • The break-even point is the level of service volume at which total revenues equal total costs. • A service volume higher than the break-even point implies that revenues exceed costs.

  4. Break-Even Analysis • Basic Linear Model • Total Revenue = Unit-revenue x Service volume TR = REV x N • Total Costs = Fixed Cost + Variable Cost TC = FC + VC • Variable Cost = Unit-cost x Service volume VC = COST x N

  5. Break-Even Analysis Basic Linear Model • Fixed costs are those that are incurred regardless of how much service is provided. • Variable costs are items of expense that relate to the direct cost of providing care and are expressed as costs per unit of service delivered.

  6. Break-Even Analysis • Solution to the Basic Linear Model TR = REV x N TC = FC + VC VC = COST x N Want to find N* for which TR = TC • N* = FC/(REV - COST)

  7. Break-Even Analysis Case Problem - (A) p. 21

  8. Break-Even Analysis Solution to the Case Problem

  9. Break-Even Analysis What-If Analysis

  10. Break-Even Analysis Model Variations

  11. Break-Even Analysis Model Variations

  12. Break-Even Analysis Model Variations

  13. Break-Even Analysis Sensitivity Analysis with Two-input Data Tables

  14. Break-Even Analysis Sensitivity Analysis with Two-input Data Tables