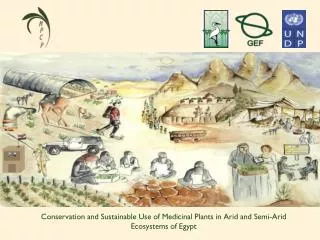
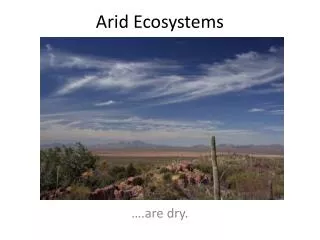
Arid Ecosystems
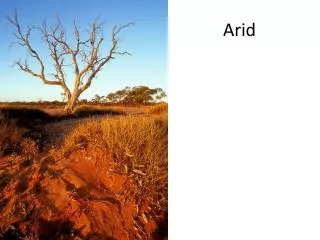
Arid Ecosystems. ….are dry. Defined by one resource: Water. Divided into 4 categories (“zones”):. Dry Sub-Humid : Kinda Dry Semi-Arid : Definitely Dry Arid : Really Dry Hyper-Arid : Pretty much like Mars. Arid. Semi-Arid Woodland. Dry Sub-Humid. 2 ways to define “zones”.

Arid Ecosystems
E N D
Presentation Transcript
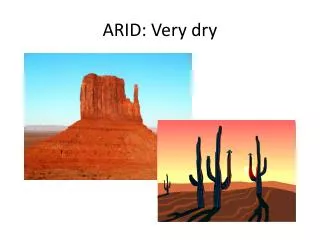
Arid Ecosystems ….are dry.
Divided into 4 categories (“zones”): • Dry Sub-Humid: Kinda Dry • Semi-Arid: Definitely Dry • Arid: Really Dry • Hyper-Arid: Pretty much like Mars
Arid Semi-Arid Woodland Dry Sub-Humid
2 ways to define “zones” • Precipitation only: Areas are classified by their mean annual precipitation. • Aridity Index: AI = p/ETP • P = precipitation • ETP = potential evapotranspiration • Basically, the amount of precipitation divided by the ability to lose water through evaporation.
Evapotranspiration • The sum amount of water that is lost through evaporation (from soil or water body surfaces) and plant transpiration (water that is cycled through plants). • Potential Evapotranspiration is the amount of evapotranspiration without water limitation, so a maximum value. • ETP takes into account abiotic factors like humidity, insolation and wind as well as biotic factors like plant cover, leaf area, and stomatal resistance. • So, it’s harder to calculate AI, but it includes the benefit of taking into account information about the ecosystem itself as opposed to using precipitation alone.
These values are not exactly universally agreed upon, but represent a fairly good representation of the amounts of rainfall and AI expected for each zone. Also, notice that the IA’s are all <1, meaning that there is more potential evaporation than precipitation = water limited. Take home message: These areas are Water Limited…. …. Sometimes during rainy periods, they do become nitrogen limited. Water washes away nitrogen.
I live in Massachusetts and get rained/snowed on every other day, why should I care about arid ecosystems? • They represent a large area of Earth’s land surface ~20-30% depending on your definition. • Are found on every continent. • Are home to ~2 billion people, and rising. • Harbor large amounts of species and genetic diversity. Especially cool species that have adapted to live in extreme environments. • Are predicted to expand in current climate change models, so they’ll probably be getting bigger.
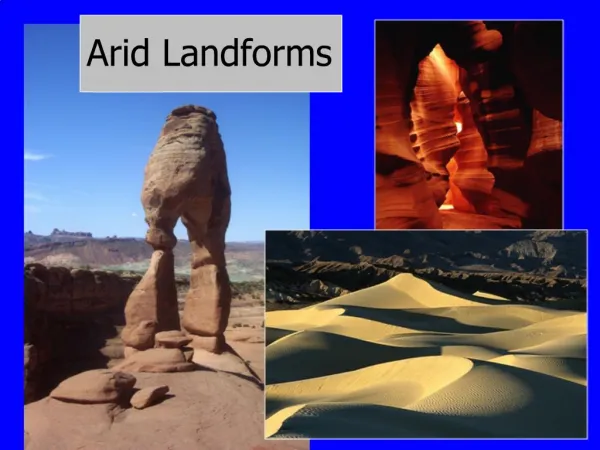
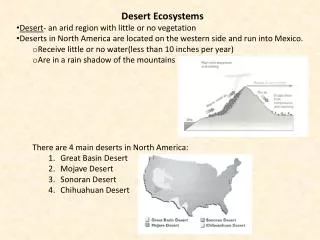
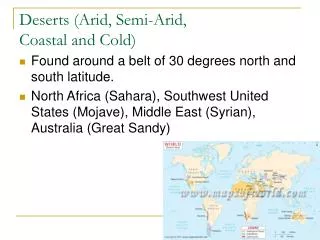
Arid zones form in three key areas. • Areas where dry air from Hadley Cells descends, or ~ 300 North and South latitude. Sahara & Patagonia. • The leeward side of mountains. Atacama & Gobi. • Polar regions. McMurdo Dry Valleys.
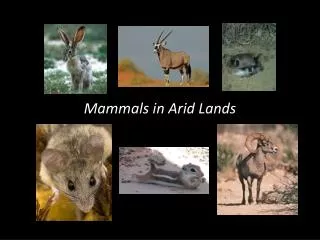
Diversity • High species diversity is due in part to sheer size and geographic distribution; arid ecosystems are everywhere. • Many of these areas are isolated… • …and ancient. • High stress generates lots of selective pressure. • Interesting defensive strategies (poison/spines or coloration) • Metabolic pathways (C4 grasses) • Water use strategies (Succulents/cacti or mice that satisfy water requirement from seeds)
Why that’s a problem • Many of the countries that contain large areas of arid land are under developed or developing. • Many residents of these areas are subsistence farmers that rely on their crops for food. • The economics and politics of these regions prevent local governments from being able to step in when drought or other conditions destroy crops. i.e Sudan this year. • Consequently, these residents are at the mercy of the climate. And anything that changes the productivity of the area will directly change the amount of food in their granaries. • So, the environment creates a problem for the people, but the people are the principal agents of the land use change that contributes to desertification, and creates a problem for the environment. It’s a vicious cycle.
Wow, these areas really are important. But how are they changing? • Highly susceptible/sensitive to climate and land use change. • Productivity is changing because • Precipitation events are becoming more variable in terms of intensity, timing, and inter-annual amounts. • CO2 concentrations in the atmosphere are increasing. • The area of arid land is predicted to increase as temperature increases. • The quality of the land itself is changing. (desertification)
Variability in precipitation • Precipitation is a function of atmospheric circulation. So, as atmospheric circulation changes so will the timing, location, and size of precipitation events. • How these changes will manifest themselves is unique to the area/desert. • The Chihuahuan desert, for example, is predicted to have the monsoon season come earlier in the year and with increased inter-annual variability. • Also, as we saw in the paper, changes in the timing of rainfall can favor certain species. • In general though, the prediction is that arid ecosystems as a whole will become drier. • Also, periods of extreme drought are predicted by climate models to become more frequent and severe. Productivity and Precipitation are inextricably linked (remember: water limited). So, as these ecosystems become drier, productivity and food production will see a corresponding decrease.
Responses to changes in precipitation are rapid and extreme 11–16% (cover) pre-El Niño 1989–90 54–80% during El Niño 1991–92 13–21% post-El Niño 1993–94 Northwest Peru
As the Earth warms, the area of arid land is predicted to get bigger Expansion is due to three factors. First, a general poleward expansion of the Hadley Cells. Second, less precipitation is predicted in the areas near the equator. Third, as an area warms, its evaporative potential increases. This compounds the effect of lower precipitation. (Bigger not necessarily better)
Desertification • Defined as “land degradation in the drylands due to various factors, including climatic variations and human activities” • Lots of “factors”: land cover/use change, grazing, biomass burning, air pollution, etc… • Pretty big deal (we’ll talk about this when we discuss the paper)
References • Text citations • Factors affecting ETP: http://www.eoearth.org/article/Evapotranspiration • El Nino cover data:Gutiérrez JR, Arancio G, and Jaksic FM. 2000.Variation in vegetation and seed bank in a Chilean semi-arid community affected by ENSO 1997. J VegSci11: 641–48. • Desertificationdefinition: Sivakumar, MVK. 2007. Interactionsbetweenclimate and desertification. Agricultural and ForestMeterology. 142, 143-155. • Image credits. • Sonoran Desert: http://www.caseysmith.net/pictures/2006SpringTrip/ • Mars: http://zuserver2.star.ucl.ac.uk/~idh/apod/ap960722.html • Hyper-arid: http://solarsystem.nasa.gov/scitech/display.cfm?ST_ID=2372 • Arid: http://www.anbg.gov.au/chabg/bg-dir/007.html • Semi arid woodland : http://www.atlas.nsw.gov.au/public/nsw/home/topic/article/vegetation.html • Dry Sub-humid: http://sci-s03.bacs.uq.edu.au/ins-info/Hab2.htm • Evapotranspiration diagram: http://www.salinitymanagement.org/Salinity%20Management%20Guide/ew/ew_2.html • Evapotranspiration map: http://www.eoeartdcch.org/article/Evapotranspiration • Climate area maps: Peel et al. 2007, Updated world map of the Koppen-Geiger climate classification. Hydrol. Earth Syst. Sci., 11, 1633–1644. • Sudan woman farming: http://understandingsudan.org/SudanimagemenuV3.asp • Egyptian farmer: http://english.ahram.org.eg/NewsContent/3/12/19451/Business/Economy/Farming-overhaul-vital-for-food,-water-security-UN.aspx • Northern Peru variability: Gutiérrez JR, Arancio G, and Jaksic FM. 2000.Variation in vegetation and seed bank in a Chilean semi-arid community affected by ENSO 1997. J VegSci11: 641–48. • Predicted change in Sahel: Held IM, Delworth TL, Lu J, Findell KL, Knutson TR. 2005. Simulation of Sahel drought in the 20th and • 21st centuries. PNAS. 102, 17891-17896