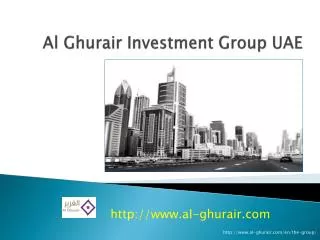
1 / 0

Our Investment Portfolio: High Quality and Diversified

Q1 2014 Investment Fact Sheet. Our Investment Portfolio: High Quality and Diversified.

arlene
Télécharger la présentation

Our Investment Portfolio: High Quality and Diversified

An Image/Link below is provided (as is) to download presentation Download Policy: Content on the Website is provided to you AS IS for your information and personal use and may not be sold / licensed / shared on other websites without getting consent from its author. Content is provided to you AS IS for your information and personal use only. Download presentation by click this link. While downloading, if for some reason you are not able to download a presentation, the publisher may have deleted the file from their server. During download, if you can't get a presentation, the file might be deleted by the publisher.

E N D

Presentation Transcript


  1. Q1 2014 Investment Fact Sheet Our Investment Portfolio: High Quality and Diversified Our investment philosophy employs a bottom-up approach which combines our strong asset management skills with an in-depth understanding of the characteristics of each investment. We are not limited to fixed income investments but rather have a diversified blend of assets, including a variety of alternative long-duration asset classes, which provides a unique competitive advantage. We use a disciplined approach across all asset classes, and we do not chase yield in the riskier end of the fixed income market. This philosophy has resulted in a well-diversified, high quality investment portfolio, with excellent credit experience. Highly Diversified Asset Mix High Quality Debt Securities and Private Placement Debt1 C$245.0 billion C$145.2 billion Fixed Income & Other Alternative Long-Duration Assets (ALDA) Public Equities BB 2% B & lower, and unrated 1% Private Placement Debt 9% Government Bonds 22% BBB 20% Securitized MBS/ABS 1% AAA 27% Mortgages 16% Corporate Bonds 27% Cash & Short-Term Securities 6% AA 19% A 31% Policy Loans 3% Bank Loans 1% Other 1% Public Equities 6% Real Estate 4% Oil & Gas 1% Power & Infrastructure 1% Private Equity & Other 1% Timberland & Farmland 1% Fixed Income 86% of the total portfolio, of which 97% is Investment Grade Alternative Long-Duration Assets Diversified by asset class and geography Historically generated enhanced yields without having to pursue riskier fixed income strategies Public Equities Diversified by industry and geography Primarily backing participating or pass-through liabilities 97% of Debt Securities and Private Placement Debt are investment grade 77% are rated A or higher 19% of Below Investment Grade holdings are Asian sovereign holdings matched against liabilities in countries in which we conduct business Our debt securities and private placement debt portfolio is of high quality with 77% rated A or higher and below investment grade holdings are limited to 3% of the portfolio. Our private placements benefit from covenants and collateral which typically provide better credit protection and higher potential recoveries. Our invested assets total C$245.0 billion and include a variety of asset classes that are highly diversified by geography and sector. This diversification has historically produced superior risk adjusted returns while reducing overall risk. “Our prudent investment approach has historically allowed us to achieve superior returns while reducing risk through diversification. Our high quality and diversified investment portfolio continues to deliver strong and steady investment experience gains.” Warren A. Thomson Senior Executive Vice President and Chief Investment Officer Chairman of Manulife Asset Management 1In order to reflect the actual credit exposure held by the Company, the credit quality carrying values have been adjusted to reflect the credit quality of the underlying issuers referenced in the credit default swaps (“CDS”) sold by the Company. At March 31, 2014, the Company had C$348 million notional outstanding of CDS protection sold. All figures in accordance with International Financial Reporting Standards “IFRS” carrying value; quoted as at March 31, 2014 unless otherwise noted.
  2. High Quality Geographical Asset Mix High Quality Securitized Holdings C$245.0 billion C$3.5 billion, representing 1% of Total Invested Assets Canada 34% U.S. 48% BB & Below 11% AAA 67% BBB 5% A 15% Hong Kong, rest of Asia & Other 9% AA 2% Japan 4% Europe 5% Presented based on location of issuer 84% rated A or better, with 67% rated AAA 100% of the CMBS holdings rated AAA are in the most senior class 56% of CMBS holdings originated from years 2005 and prior ABS holdings highly rated and diversified by sector Assets in Greece, Italy, Ireland, Portugal and Spain limited to <0.2% of total invested assets 43% of Asia & Other assets (including Japan) represent sovereign issuers We currency match our assets with our liabilities, so most of the Asian holdings are local currency bonds backing local currency liabilities. The European holdings are largely US$ issues backing US$ liabilities. Our Structured Credit portfolio totals C$3.5 billion, or 1% of total invested assets. Of this, C$0.9 billion are commercial mortgage-backed securities (CMBS), C$0.5 billion are residential mortgage-backed securities (RMBS), and C$2.1 billion are other asset-backed securities (ABS), 89% of the portfolio is rated as investment grade, demonstrating the high quality of these holdings. Highly Diversified Debt Securities and Private Placement Debt C$145.2 billion, representing 59% of Total Invested Assets Utilities 17% “Our private placement debt portfolio helps further diversify the fixed income portfolio by name and by industry as it provides opportunities not available in the public markets. Private placements also typically contain protective covenants not generally available in the public bond market.” Scott Hartz Executive Vice President – General Account Investments Government & Agency 39% Banks 7% Energy 7% Consumer (non-cyclical) 6% Insurance 1% Industrial 5% Captive Finance Subs 1% Other 4% Other Financial Services 3% Securitized MBS/ABS 2% Consumer (cyclical) 2% REITS & Real Estate Related 3% Basic Materials 3% Diversified across 13 primary sectors 49% of issuers are outside of the U.S. No single position represents more than 1% of invested assets (excluding government holdings) Our bond portfolio is highly diversified by industry sector and geography. It includes private placements of C$21.8 billion, or 15% of our total bond portfolio, which are a great source of diversification by name, industry and geography. All figures in accordance with International Financial Reporting Standards “IFRS” carrying value; quoted as at March 31, 2014 unless otherwise noted.
  3. High Quality Direct Mortgage Portfolio High Quality Commercial Real Estate Holdings Fair value of C$10.3 billion, representing 4% of Total Invested Assets on a fair value basis C$38.3 billion, representing 16% of Total Invested Assets By Property Type Commercial Mortgages Other Mortgages Fair Value, By Type Canadian Single-family residential – CMHC1 insured 24% Retail 16% Office - Suburban 16% Office – Downtown 51% Office 15% Company Own-Use 14% Industrial 6% Canadian single- family residential 21% Residential 9% Multi-family Residential 8% Agriculture 3% Industrial 6% Other Commercial – CMHC1 insured 1% Multi-family Residential - CMHC1Insured 2% Retail 3% Other 1% Other Commercial4% Diversified by geography 62% of portfolio is based in Canada, with remainder in the U.S. C$10.3 billion or 27% of total mortgage portfolio is insured, primarily by CMHC1 Virtually no leverage Average occupancy rate of 93.9% Average lease term of 6.6 years Diversified by geography: 61% U.S., 36% Canada, and 3% Asia Holdings (C$ Millions) Non-CMHC Insured Commercial Mortgages Conservatively underwritten with low loan-to-value and high debt-service coverage ratios 1 CMHC is Canada Mortgage and Housing Corporation, Canada’s AAA rated national housing agency, and is the primary provider of mortgage insurance. 2 Excludes CMHC insured loans and Manulife Bank commercial mortgage loans. 3LTV and DSC are based on current loan review cash flows. 4Arrears defined as over 90 days past due in Canada and over 60 days past due in the U.S. The fair value of our commercial real estate portfolio is C$10.3 billion and represents 4% of our total invested assets on a fair value basis. This is a high quality portfolio, with virtually no leverage and mostly premium urban office towers, concentrated in cities with stable growth and highly diverse economies in North America and Asia. With an average occupancy rate of 93.9% and average lease term of 6.6 years, we are well positioned to manage through challenging economic conditions. We have C$19.9 billion in commercial mortgages which have been conservatively underwritten and continue to have low loan-to-value and high debt-services-coverage ratios. We are well diversified by property type and we avoid risk segments of the markets such as hotels, construction loans and second liens. Further, we currently do not have any loans in arrears. Our Canadian residential mortgage portfolio includes high quality residential mortgages issued by Manulife Bank of Canada, with 53% insured, primarily by CMHC1. Our agriculture loans are well diversified by business type and geography. All figures in accordance with International Financial Reporting Standards “IFRS” carrying value; quoted as at March 31, 2014 unless otherwise noted.
  4. Other Alternative Long-Duration Assets Other Notable Items Financials fixed income net exposure1 of C$14.4 billion is well diversified by geography, sub-sector and name Gross unrealized losses limited to C$1.7 billion or 1.2% of our fixed income portfolio. Gross unrealized losses for Fixed Income securities trading at less than 80% of cost for greater than 6 months of only C$0.1 billion or 0.1% of fixed income portfolio The potential future impact to shareholder’ pre-tax earnings for Fixed Income securities trading at less than 80% of cost for greater than 6 months is limited to C$51 million Monoline insurance net exposure1 of C$442 million in wrapped bonds but we place no reliance on the guarantees Limited net exposure1 to: RMBS (C$502 million) European bank hybrids (C$147 million)2 Greece, Italy, Ireland, Portugal, and Spain2: No direct sovereign or financial sector debt exposure to Greece, Portugal, or Spain Bank, financial and sovereign debt (C$31 million) Limited exposure to credit default swaps (“CDS”), with C$348 million notional outstanding of CDS protection sold, of which 100% is rated A or higher Our credit experience has been excellent, with US credit losses 37% lower than the average US insurer from 2008-2012 according to a Moody’s study3 We never add credit or liquidity risk to our securities lending programs We avoided sophisticated and complex instruments that performed poorly during the financial crisis (SIV, CPDO, HELCO, Synthetic Securities, etc) C$11.3 billion, representing 4% of Total Invested Assets Timberland 22% Power & Infrastructure 32% Private Equity 20% Other 1% Farmland 10% Oil and Gas 15% Real Assets represent investments in varied sectors of the economy A good match for long duration liabilities Alternative source of asset supply to long-term Corporate bonds Majority of the assets are managed in-house; we have significant experience in managing and originating these assets Our other alternative long-duration assets have a carrying value of C$11.3 billion representing 4% of our total invested assets. These alternative long-duration assets have historically generated enhanced yields and diversification relative to traditional fixed income markets. The longer term nature of these assets is a good match for our long duration liabilities, and results in superior risk adjusted returns without having to pursue fixed income strategies. The fair value of our other alternative long-duration assets is C$11.5 billion and represents 4% of our total invested assets on a fair value basis. All figures in accordance with International Financial Reporting Standards “IFRS” carrying value; quoted as at March 31, 2014 unless otherwise noted. 1 Excludes par and pass-thru and reflects the cumulative impact of downgrades on reserves. 2 Presented based on location of issuer. 3 Moody’s “US Life Insurers’ Credit Losses Return to Long-Term Historical Levels in 2012 – “June 28, 2013. “We have always followed a very prudent investment approach – avoiding complexity, setting limits, diversifying, and applying a healthy dose of skepticism in all our credit decisions – and this philosophy serves us well today, as it has in the past.” Donald A. Guloien President and Chief Executive Officer
More Related