Download
1 / 21
210 likes | 396 Vues
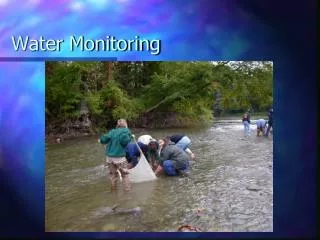
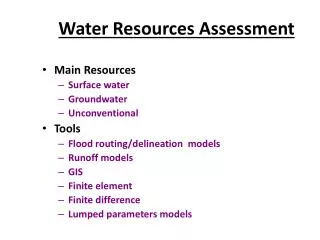
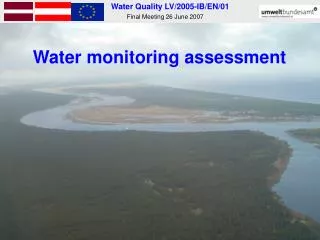
Water monitoring assessment. Questions related to monitoring water quality. What is the water quality status?. What are the fluxes of matter and pollutants ?. What are the trends ?. What are the ecosystems at risk ?. What are the consequences of land use/cover changes on water quality?.

E N D
Questions related to monitoring water quality What is the water quality status? What are the fluxes of matter and pollutants ? What are the trends ? What are the ecosystems at risk ? What are the consequences of land use/cover changes on water quality?
Keep the long-term series Re-enforce the connections between monitoring networks Climate monitoring network Hydrology Surface water Groundwater spatio-temporal representativeness
l/s/km2 14 12 10 8 Daugava 6 4 2 0 km2 0 20000 40000 60000 80000 100000 14 12 10 l/s/km2 8 6 4 2 0 0 5000 10000 km2 Catchment surface (km2) versus Specific run-off (l/s/km2) Large variability in small catchments
700 y = 0.008x r2 = 0.998 500 300 100 0 0 20000 40000 60000 80000 100000 100 y = 0.0072 r2 = 0.9198 80 60 Discharge (m3/s) 40 20 0 km2 0 2000 4000 6000 8000 10000 10 y = 0.0075x r2 = 0.672 Prediction decreases in small catchments 8 6 Discharge (m3/s) 4 2 0 km2 0 200 400 600 800 1000 1200 Catchment surface (km2) versus Average discharge (m3/s) Discharge (m3/s) km2
max discharge / min discharge 200 150 0 km2 0 100 20000 40000 60000 80000 100000 50 200 150 Svete - Uzini max discharge / min discharge Amata - Melturi 100 Durbe - Cirava Barta - Dukupji 50 km2 0 0 5000 10000 Catchment surface (km2) versus max discharge / min discharge
Water quality monitoring assessment Existing network
Existing water quality monitoring in Latvia Catchment land-cover
80 60 40 20 0 0 5000 10000 15000 20000 25000 80 60 % Forest 40 20 0 0 500 1000 1500 2000 km2 Existing water quality monitoring network Catchment surface (km2) versus % of forest % Forest km2 ?
80 60 % of Agriculture 40 20 0 0 5000 10000 15000 20000 25000 km2 80 60 % of Agriculture 40 20 0 0 500 1000 1500 2000 km2 Existing water quality monitoring network Catchment surface (km2) versus % of agriculture ?
189 136 149 112 148 436 4 11 37 40 % Agriculture versus % wetland 37 30 % Wetland 20 227 172 10 6 0 % Agriculture 0 20 40 60 80 100 11 50 4 40 % Agriculture versus % lakes 58 3 30 % Lake 20 6 10 0 0 20 40 60 80 100 % Agriculture Existing water quality monitoring network 80 % Forest versus % agriculture 60 % Agriculture 40 20 6 0 0 20 40 60 80 100 % Forest
250 200 Catchment surface (km2) versus density of population 150 100 50 0 0 5000 10000 15000 20000 25000 250 200 % of Forest versus density of population 150 Inh / km2 100 50 0 0 20 40 60 80 100 % forest 250 200 % of Agriculture versus density of population 150 Inh / km2 100 50 0 0 20 40 60 80 100 % Agriculture Existing water quality monitoring network Inh / km2 km2
Water quality monitoring assessment Proposed network
Biogeochemical monitoring Proposed water quality monitoring in Latvia Sampling effort Nutrients (N & P) & Basic indicators (O2 – pH, conductivity, SM) Temporal representation 1172 analyses
128 80 560 30 50 34 216 14 12 26 51 260 15 20 35 32 156 8 15 23 245 1172 221 24 1192 67 97 164 Water quality monitoring Choose the best spatio-temporal framework for water quality monitoring Proposed water quality monitoring in Latvia Sampling effort Nutrients (N & P) & Basic indicators (O2 – pH, conductivity, SM)
67 sites with monthly sampling instead of 24 including low and high water seasonal sampling 97 sites with seasonal sampling instead of 221 Purchase autonomous automatic samplers Measure Dissolved Organic Carbon Proposal for nutrients and basic indicators Sampling at low water in summer in winter Sampling at high water during snowmelt in autumn 1 - Easy to planify 2 - Meaningfull in terms of representativeness of low flow (baseflow) conditions 3 - Provides realistic values to calculate nutrient fluxes
Proposed water quality monitoring in Latvia Sampling effort Major ions (K – Na – Mg – Ca – HCO3 – SO4 – Hardness – Cl)
Proposed water quality monitoring in Latvia Minor ions (Cd – Pb – Hg – Ni – Cu – Zn – As – Cr)
Proposed water quality monitoring in Latvia Organic pollutants (naphtas, pesticides, phenols)