Data Envelopment Analysis (DEA)
Data Envelopment Analysis (DEA). Which Unit is most productive?. DMU labor hrs. #cust. 1 100 150 2 75 140 3 120 160 4 100 140 5 40 50. DMU = decision making unit.

Data Envelopment Analysis (DEA)
E N D
Presentation Transcript
Which Unit is most productive? DMU labor hrs. #cust. 1 100 150 2 75 140 3 120 160 4 100 140 5 40 50 DMU = decision making unit
DEA (Charnes, Coopers & Rhodes ‘78)A multiple-input, multiple-output productivity measurement tool Basic intuition (DMU = decision making unit) DMU labor hrs. #cust. #cust/hr. 1 100 150 1.50 2 75 140 1.87 3 120 160 1.33 4 100 140 1.40 5 40 50 1.25 #cust. 200 x slope = 1.87 x x DMU’s 1,3,4,5 are dominated by DMU 2. x 100 x labor hrs. 50 100
Extending to multiple outputs ... Ex: Consider 8 M.D.’s working at Shouldice Hospital for the same 160 hrs. in a month. Each performs exams and surgeries. Which ones are most “productive”? Note: There is some “efficient” trade-off between the number of surgeries and exams that any one M.D. can do in a month, but what is it?
Efficient M.D.’s: These two M.D.’s (#1 and #6) define the most efficient trade-off between the two outputs. Scatter plot of outputs: #6 efficient frontier #1 These points are dominated by #1 and #6. “Pareto-Koopman efficiency” along the frontier - cannot increase an output (or decrease an input) without compensating decrease in other outputs (or increase in other inputs).
How bad are the inefficient M.D.s and where are the gaps? #5 Performance “gap” 73.4% of distance to frontier Efficiency score = 73.4%
“Nearest” efficient points define a reference set and a linear combination of the reference set inputs and outputs defines a hypothetical composite unit (HCU) Reference set for #5 is {1,6} #6 #5 #1 HCU
DEA summary so far: DEA uses an efficient frontier to define multiple I/O productivity • Frontier defines the (observed) efficient trade-off among inputs and outputs within a set of DMUs. • Relative distance to the frontier defines efficiency • “Nearest point” on frontier defines an efficient comparison unit (hypothetical comparison unit (HCU)) • Differences in inputs and output between DMU and HCU define productivity “gaps” (improvement potential) How do we do this analysis systematically?
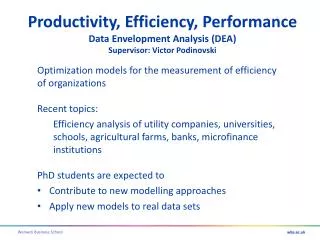
Conceptually ... Productivity = Outputs Inputs Productivity Reality if more complex ... Inputs Outputs Technology + Decision Making equipment #type A cust. facility space #type B cust. server labor quality index mgmt. labor $ oper. profit
Operating Units Differ • Mix of customers served • Availability and cost of inputs • Facility configuration • Processes/practices used • Examples • bank branches, retail stores, clinics, schools, etc. Questions: • How do we compare productivity of a diverse set of operating units serving a diverse set of markets? • What are the “best practice” and under-performing units? • What are the trade-offs among inputs and outputs? • Where are the improvement opportunities and how big are they?
Some approaches • Operating ratios • e.g. Labor-hrs/transaction, $sales/sq.-ft. • Good for highly standardized operations • Problem: Does not reflect varying mix of inputs and outputs found in more diverse operations • Financial approach: Convert everything to $$$! • Problems? • Some inputs/outputs cannot be valued in $ (non-profit) • Profitability is not the same as operating efficiency (e.g. variances in margins and local costs matter as well) $Inputs $Outputs
Profitability vs. effeciency • Profitability is a function of 3 elements … • Input prices (costs) • Output prices • Technical efficiency (How much input is required to generate the firms output.) • Improving operations requires understanding technical efficiency not just overall profitability.
LP Formulation: Data Model variables
To evaluate a give unit, e, choose nonnegative weights to solve ... Which can be formulated Normalize weighted input of e to one
Output analysis These dual variables can be used to contruct an efficient hypothetical composite unit (HCU) with Output j of HCU Input i of HCU Satisfying
HCU can be used to measure excess use of inputs and potential increase in outputs Refer to spreadsheet examples.
Using the results: Eff.-Profit Matrix High Profit Under-performing potential leaders Best practice comparison group Low Eff. High Eff. Under-performing possibly profitable Candidates for closure Low Profit
Designing DEA Studies • #Inputs/Ouputs K > 2(N+M) • “Ambivalence” about inputs and outputs - all should be relatively important! • “Approximate similarity” among DMUs • objectives • technology • Provides relative efficiency only • choice of units to include matters • inclusion of “global leader” unit may be desirable • Experimenting with different I/O combinations may be necessary
DEA Summary • Addresses fundamental productivity measurement problems due to ... • complexity of service outputs • variability in service outputs • Takes advantage of service operating environment • large numbers of similar facilities • diversity of practices/management/environment • Provides useful information • objective measures of productivity • reference set of comparable units • excess use of inputs measure • returns to scale measure
DEA Summary (cont.) • Role of DEA • “data mining” to generate hypotheses • evaluation/measurement • benchmarking to identify “best practice” units • Caveats • “black box” - No information on root causes of inefficiency • Be aware of assumptions (e.g. linearity) • Can be sensitive to selection of inputs/outputs