Two-stage Data Envelopment Analysis
Two-stage Data Envelopment Analysis. Foundation and recent developments Dimitris K. Despotis, University of Piraeus, Greece. ICOCBA 2012, Kolkata, India. Data Envelopment Analysis (DEA) (based on the seminal work of Farrell, 1957). William W . Cooper 1914-2012. Abraham Charnes

Two-stage Data Envelopment Analysis
E N D
Presentation Transcript
Two-stage Data Envelopment Analysis Foundation and recent developments Dimitris K. Despotis, University of Piraeus, Greece ICOCBA 2012, Kolkata, India
Data Envelopment Analysis (DEA)(based on the seminal work of Farrell, 1957) William W. Cooper 1914-2012 Abraham Charnes 1917-1992 Edwardo Rhodes Rajiv Banker Charnes, Cooper and Rhodes, Measuring the efficiency of decision making units, European Journal of Operational Research2 (1978), pp. 429-444. Banker, Charnes and Cooper, Some models for estimating technical and scale inefficiencies in data envelopment analysis, Management Science, 30 (1984), pp. 1078-1092.
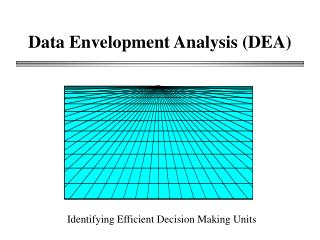
What is DEA • DEA is a linear programming technique for evaluating the relative efficiency of a set of peer entities, called Decision Making Units (DMUs), which use multiple inputs to produce multiple outputs. • DEA identifies an efficient mix of DMUs that achieve specified levels of the outputs with the minimal deployment of resources (inputs). The resources deployed by the efficient mix are then compared with the actual resources deployed by a DMU to produce its observed outputs. This comparison highlights whether the DMU under evaluation is efficient or not.
Decision making units Inputs Outputs • homogeneous • Independent • “black box” • internal structure unknown • transformation mechanism (production function) unknown DMU
Efficiency • The efficiency of a DMU is defined as the ratio of a weighted sum of the outputs yielded by the DMU over a weighted sum of its inputs s outputs: y1, y2, …,ys m inputs: x1, x2, …, xm Virtual output Virtual input
Returns to scale • Constant returns-to-scale (CRS–CCR model) • Variable returns-to scale (VRS – BCC model) C B Output VRS CRS Production possibility set A O Input
Orientation • Input oriented model • The objective is to minimize inputs while producing at least the given output levels • Output oriented model • The objective is to maximize outputs while using no more than the observed amount of any input Output oriented projection C B Efficiency of unit D: CRS: PQ/PD VRS: PR/PD VRS ≥ CRS Output Input oriented projection P Q R D A O Input
The fractional form (CRS-input oriented) n DMUs s outputs m inputs j0 the evaluated unit
Input oriented model - CRS The multiplier form The envelopment form Dual At optimality: 0<θ≤1
Input oriented model - VRS The multiplier form The envelopment form Dual
Opening the black box In some contexts, the knowledge of the internal structure of the DMUs can give further insights for the DMU performance evaluation DMU X Y - DM subunits (DMSU) - (Sub)processes - Components L. Castelli, R. Pesenti, W. Ukovich , A classification of DEA models when the internal structure of the Decision Making Units is considered, Ann Oper Res (2010)
yj zj Stage 1 Stage 2 DMU j xj The fundamental two-stage production process • The external inputs entering the first stage of the process are transformed to a number of intermediate measures that are then used as inputs to the second stage to produce the final outputs. • DMUs are homogeneous.
Profitability and marketability of the top 55 U.S. Commercial Banks (Seiford and Zhu, 1999) Market value Employees Revenues Total returns to investors Assets Profitability Marketability Profits Earnings per share Equity Stage 1 Stage 2
The multiplicative approach 1/5Kao and Hwang (2008) A series relationship is assumed between the stages. The value of the intermediate measures Z is assumed the same, no matter they are considered as outputs of the first stage or inputs to the second stage. Stage -1 efficiency Stage-2 efficiency X Y Stage 2 Stage 1 Z Overall DMU efficiency = stage 1 . stage 2
The multiplicative approach 5/5Kao and Hwang (2008) • The multiplicative model is not extendable to VRS situations • Chen, Cook and Zhu (2010) provide a modeling framework to derive the efficient frontier
The additive approach 1/4Chen, Cook, Li and Zhu (2009) A series relationship is assumed between the stages. The value of the intermediate measures Z is assumed the same, no matter they are considered as outputs of the first stage or inputs to the second stage. Stage -1 efficiency Stage-2 efficiency X Y Stage 2 Stage 1 Z Overall DMU efficiency = t1. stage 1 + t2. stage 2 (t1+t2=1)
The additive approach 4/4Chen, Cook, Li and Zhu (2009) • The additive decomposition approach is extendable to VRS situations • Does not comply with the rule that VRS efficiency scores >= CRS scores • Does not provide sufficient information to derive the efficient frontier
An alternative additive model A series relationship is assumed between the stages. The value of the intermediate measures Z is assumed the same, no matter they are considered as outputs of the first stage or inputs to the second stage. Stage -1 efficiency Stage-2 efficiency X Y Stage 2 Stage 1 Z Overall DMU efficiency = ½ stage 1 + ½stage 2
An alternative additive model Output oriented Input oriented X Y Stage 2 Stage 1 Z
An alternative additive model Output oriented Input oriented X Y Stage 2 Stage 1 Z Common constraints, bi-objective LP
An alternative additive model Stage-2 Stage-1 Simple average …
An alternative additive model … or a weighted average a1, a2 user defined weights, or weights reflecting the “size” of the stages with respect to the portion of total resources used in each stage (in raw quantities)
An alternative additive model The primal model The dual model
An alternative additive model • The model is extendable to VRS situations • The new model suffers from the same irregularities with other additive-decomposition models
Deriving the efficient frontiers Dual Primal
Deriving the efficient frontiers • The assumption that the weights of the intermediate measures are equal is sufficient to drive the efficiency assessments in two-stage DEA processes in compliance with the DEA standards
Extensions - Conclusions Z1 Zk Y • Two-stage DEA: A fundamental approach • Extensions to multi-stage processes • Other two-stage schemes X ….. H Y Z X E