Performance Evaluation and Benchmarking with Data Envelopment Analysis
Performance Evaluation and Benchmarking with Data Envelopment Analysis. Chapter 15. Multi-Site Performance Evaluation. Multi-site evaluation technique: Data Envelopment Analysis. Chapter 15 - Performance Evaluation and Benchmarking with Data Envelopment Analysis. 1. Multi-Site Services.

Performance Evaluation and Benchmarking with Data Envelopment Analysis
E N D
Presentation Transcript
Performance Evaluation and Benchmarking with Data Envelopment Analysis Chapter 15
Multi-Site Performance Evaluation • Multi-site evaluation technique: • Data Envelopment Analysis Chapter 15 - Performance Evaluation and Benchmarking with Data Envelopment Analysis 1
Multi-Site Services Franchised Owned Midas (brake/muffler repair) 2,237 345 Budget Rent-A-Car 2,574 401 Management recruiters/ 570 45 sales consultants (executive search firms) McDonald’s 15,000 5,000 Barclay’s Bank 2,700 (total – approx.) Chapter 15 - Performance Evaluation and Benchmarking with Data Envelopment Analysis 2
Multi-Site Services Franchised Owned Novus windshield repair 1,885 18 Subway (sandwiches) 10,890 0 Century 21 Real Estate Corp. 6,094 0 Re/Max International (real estate) 2,509 0 Uniglobe Travel (travel agents) 1,129 0 Chapter 15 - Performance Evaluation and Benchmarking with Data Envelopment Analysis 3
Performance Evaluation • Purposes • Evaluation • units- employees • Resource Allocation • rationalize personnel/capital • expense control • unit closure • Classification • recognition/reward • identification Chapter 15 - Performance Evaluation and Benchmarking with Data Envelopment Analysis 4
Performance Evaluation • Measures • Profit • Sales volume • Contribution margin • Customer service • Market share • Methods • Negotiated goals • Outputs (neglecting inputs available) Chapter 15 - Performance Evaluation and Benchmarking with Data Envelopment Analysis 5
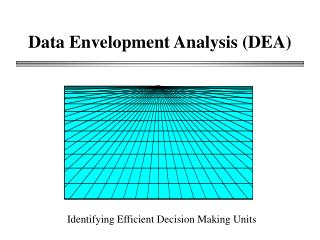
Data Envelopment Analysis (DEA) • Use – efficiency evaluation for multi-site service firms • Conditions for use: • Results ambiguity • Results measurement incompatibility • Service unit similarity Chapter 15 - Performance Evaluation and Benchmarking with Data Envelopment Analysis 6
Advantages of DEA • DEA Output • Single number • Most favorable linear combination of outputs/inputs to unit compared to the outputs/inputs of all other units • Advantages • Data reduction • Objectivity • Environmental change response • Doesn’t reward sand-bagging • Doesn’t punish superior performers Chapter 15 - Performance Evaluation and Benchmarking with Data Envelopment Analysis 7
Applications of DEA • Non-profit • Education, health care, armed forces, public housing, transportation, facility location (superconducting supercollider) • For-profit • Banking, retail, mining, agriculture • Users (“Frontier Analyst” software by Banxia) • AMEC Offshore Development, Ameritech, Banca Populare diMilano, Bank of Scotland, Boston Consulting Group, British Gas Transco, CalEnergy Company Inc., Carlson Marketing Group… Chapter 15 - Performance Evaluation and Benchmarking with Data Envelopment Analysis 8
DEA in Retail Banking Parkan, C. (1994), “Operational Competitiveness Ratings of Production Units,” Managerial and Decision Economics, 15, 201‑221. Pastor, J. (1994), “How to Discount Environmental Effects in DEA: An Application to Bank Branches,” Working Paper, Universidad de Alicante, Alicante, Spain. Roll, Y. and B. Golany (1993), “Alternative Methods of Treating Factor Weights in DEA,” Omega, 21, 1, 99‑109. Schaffnit, C., D. Rosen and J. Paradi (1997), “Best Practice Analysis of Bank Branches: An Application of DEA in a Large Canadian Bank,” European Journal of Operational Research, 98, 269-289. Sherman, H. (1984), “Improving the Productivity of Service Businesses,” Sloan Management Review, 11‑22. Sherman, H. and F. Gold (1985), “Bank Branch Operating Efficiency,” Journal of Banking and Finance, 9, 297‑315. Sherman, H. and G. Ladino (1995), “Managing Bank Productivity Using Data Envelopment Analysis (DEA)”, Interfaces, 25, 2, 60‑73. Al‑Faraj, T., A. Alidi and K. Bu‑Bshait (1993), “Evaluation of Bank Branches by Means of Data Envelopment Analysis,”International Journal of Operations & Production Management, 13, 9, 45‑52. Athanassopoulos, A. (1997), “Service Quality and Operating Efficiency Synergies for Management Control in the Provision of Financial Services: Evidence from Greek Bank Branches,”European Journal of Operational Research, 98, 300-313. Chase, R., G. Northcraft and G. Wolf (1984), “Designing High-Contact Service Systems: Application to Branches of a Savings and Loan,”Decision Sciences, 15, 542-555. Drake, L . and B. Howcroft (1994), “Relative efficiency in the Branch Network of a UK Bank: An Empirical Study,”Omega, 22, 1, 83‑90. Giokas, D. (1991), “Bank Branch Operating Efficiency: A Comparative Application of DEA and the Loglinear Model,”OMEGA, 19, 6, 549-557. Haag, S. and P. Jaska (1995), “Interpreting Inefficiency Ratings: an Application of Bank Branch Operating Efficiencies,”Managerial and Decision Economics, 16, 7‑14. Chapter 15 - Performance Evaluation and Benchmarking with Data Envelopment Analysis 9
Structure of DEA Models • Efficiency = Outputs/Inputs • Efficiency rating from 0 (worst) to 1 (best) • Non-linear programming model • Maximize Outputs/Inputs of a specific service unit • s.t. Outputs/Inputs 1 for every service unit • No a priori weighting of outputs or inputs assumed Chapter 15 - Performance Evaluation and Benchmarking with Data Envelopment Analysis 10
Structure of DEA Model • Linear model • constants: outputs, inputsvariables: output weights, input weights • Analyze units one at a time • Maximize Outputsi x Output weight (specific unit j) s.t. [(outputsi x output weight)/(inputsi x input weight) 1] (outputsi x output weight) – (inputsi x input weight) 0 for all other units Inputsj x input weight = 1 for specific unit j Chapter 15 - Performance Evaluation and Benchmarking with Data Envelopment Analysis 11
DEA Example Problem Data Chapter 15 - Performance Evaluation and Benchmarking with Data Envelopment Analysis 12
DEA Example Problem Graph 35 30 25 20 15 10 5 HCUB A C HCUD B D Deposits E 0 5 10 15 20 25 30 Loans Chapter 15 - Performance Evaluation and Benchmarking with Data Envelopment Analysis 13
DEA Example Problem Data Chapter 15 - Performance Evaluation and Benchmarking with Data Envelopment Analysis 14
DEA Example Problem • Maximize 15 loan weight + 25 deposit weight s.t. 10 loan weight + 31 deposit weight – 100 inputs 0 15 loan weight + 25 deposit weight – 100 inputs 0 20 loan weight + 30 deposit weight – 100 inputs 0 23 loan weight + 23 deposit weight – 100 inputs 0 30 loan weight + 20 deposit weight – 100 inputs 0 100 inputs = 1 Chapter 15 - Performance Evaluation and Benchmarking with Data Envelopment Analysis 15
DEA Example Problem Variables (weights): Loans = 0.00313 Deposits = 0.03125 Breakdown of efficiency: Loans = 0.00313 x 15 = 0.05 Deposits = 0.03125 x 25 = 0.78 Reference set: A and C Chapter 15 - Performance Evaluation and Benchmarking with Data Envelopment Analysis 16
Modeling Considerations • Strategic Link • Variable number rule: • Observations > 2x(outputs + inputs) • Unit Similarity: Scales economies/diseconomies Chapter 15 - Performance Evaluation and Benchmarking with Data Envelopment Analysis 17
Model Adaptations • Bounding Variable Weights • Example: at most 70% of total efficiency from loans Maximize 15 loan weight + 25 deposit weights.t. 10 loan weight + 31 deposit weight – 100 inputs 0 15 loan weight + 25 deposit weight – 100 inputs 0 20 loan weight + 30 deposit weight – 100 inputs 0 23 loan weight + 23 deposit weight – 100 inputs 0 30 loan weight + 20 deposit weight – 100 inputs 0 100 inputs = 1 15 loan weight/ (15 loan weight + 25 deposit weight) 0.7 Rearranging terms4.5 loan weight – 17.5 deposit weight 0 Chapter 15 - Performance Evaluation and Benchmarking with Data Envelopment Analysis 18
Linear Programming on Excel • 1st time through: Tools, Solver Target cell (objective function) D28 [tab] By changing cells (variables) C23:J23 [tab] Subject to… Add C23:J23 ≥ 0) K9:K18 0 K21 = 1 Options, Assume Linear Model Solve • After 1st time Copy appropriate information down, Tools, Solver, Solve Chapter 15 - Performance Evaluation and Benchmarking with Data Envelopment Analysis 19