Download
1 / 51
620 likes | 1.07k Vues
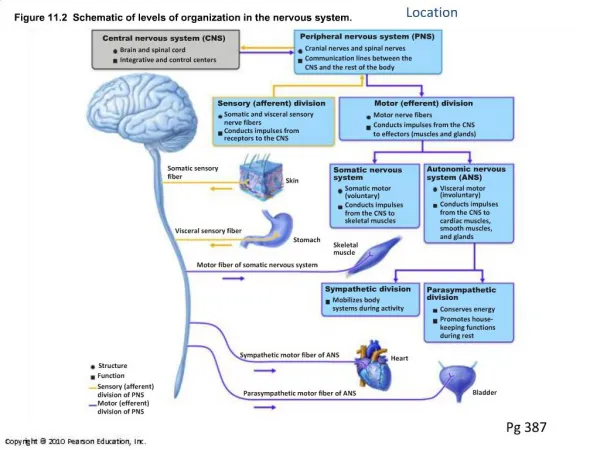
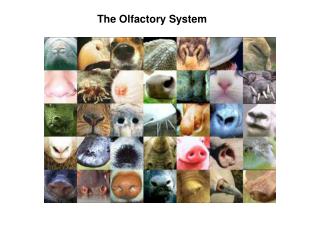
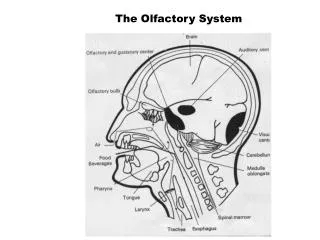
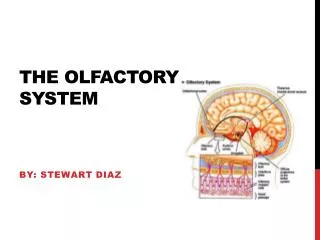
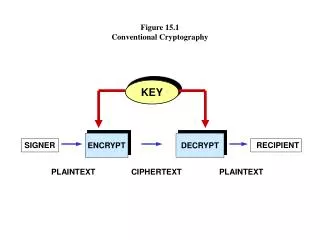
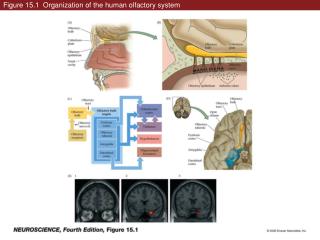
Figure 15.1 Organization of the human olfactory system. Figure 15.1 Organization of the human olfactory system (Part 1). Figure 15.1 Organization of the human olfactory system (Part 2). Figure 15.1 Organization of the human olfactory system (Part 3).

E N D
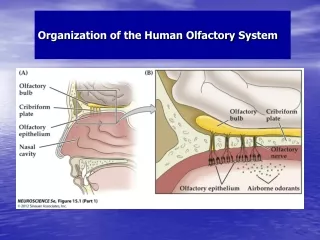
Figure 15.1 Organization of the human olfactory system (Part 1)
Figure 15.1 Organization of the human olfactory system (Part 2)
Figure 15.1 Organization of the human olfactory system (Part 3)
Figure 15.1 Organization of the human olfactory system (Part 4)
Figure 15.1 Organization of the human olfactory system (Part 5)
Figure 15.3 Anosmia is the inability to identify common odors
Figure 15.4 Normal decline in olfactory sensitivity with age
Figure 15.5 Hypothalamus activation in subjects exposed to a sex hormone-containing odor mix
Figure 15.6 Structure and function of the olfactory epithelium
Figure 15.6 Structure and function of the olfactory epithelium (Part 1)
Figure 15.6 Structure and function of the olfactory epithelium (Part 2)
Box 15A Pheromones, Reproduction, and the Vomeronasal System
Figure 15.9 Molecular mechanisms of odorant transduction (Part 1)
Figure 15.9 Molecular mechanisms of odorant transduction (Part 2)
Figure 15.10 Responses of olfactory receptor neurons to selected odorants
Figure 15.12 Responses of a single olfactory receptor neuron to odorant concentration
Figure 15.13 The organization of the mammalian olfactory bulb
Figure 15.13 The organization of the mammalian olfactory bulb (Part 1)
Figure 15.13 The organization of the mammalian olfactory bulb (Part 2)
Figure 15.13 The organization of the mammalian olfactory bulb (Part 3)
Figure 15.14 Mapping responses of chemically distinct odorants in individual glomeruli
Figure 15.16 Taste buds and the peripheral innervation of the tongue
Figure 15.16 Taste buds and the peripheral innervation of the tongue (Part 1)
Figure 15.16 Taste buds and the peripheral innervation of the tongue (Part 2)
Figure 15.17 Taste buds, taste cells, and taste transduction
Figure 15.17 Taste buds, taste cells, and taste transduction (Part 1)
Figure 15.17 Taste buds, taste cells, and taste transduction (Part 2)
Figure 15.18 Taste transduction via ion channels and G-protein–coupled receptors
Figure 15.18 Taste transduction via ion channels and G-protein–coupled receptors (Part 1)
Figure 15.18 Taste transduction via ion channels and G-protein–coupled receptors (Part 2)
Figure 15.18 Taste transduction via ion channels and G-protein–coupled receptors (Part 3)
Figure 15.19 Specificity in peripheral taste coding supports the labeled line hypothesis
Figure 15.19 Specificity in peripheral taste coding supports the labeled line hypothesis (Part 1)
Figure 15.19 Specificity in peripheral taste coding supports the labeled line hypothesis (Part 2)