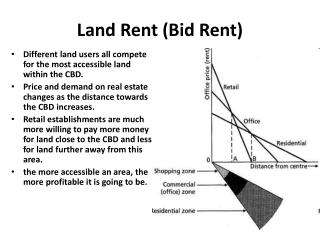
Download
1 / 21
210 likes | 365 Vues
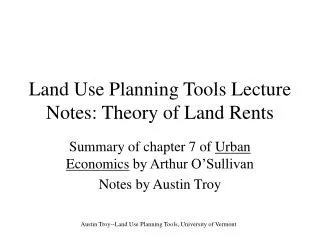
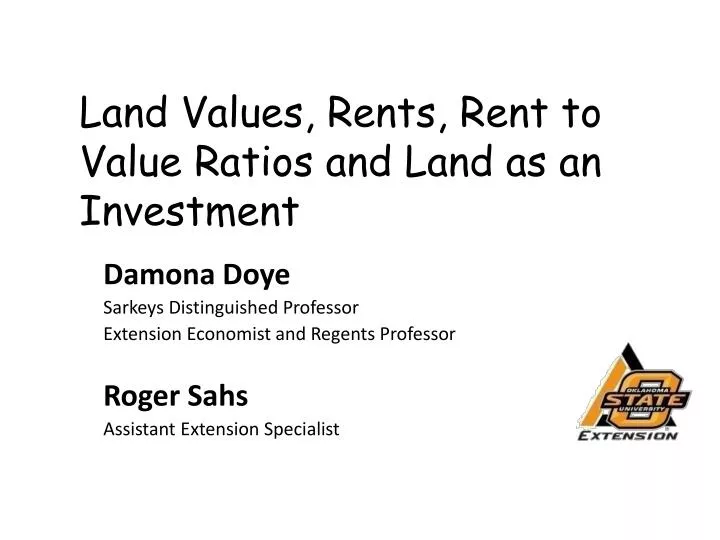
Damona Doye Sarkeys Distinguished Professor Extension Economist and Regents Professor Roger Sahs Assistant Extension Specialist. Land Values, Rents, Rent to Value Ratios and Land as an Investment. A new website, aglease.info & a reminder about aglease101.org. Sources of data.

E N D
Damona Doye Sarkeys Distinguished Professor Extension Economist and Regents Professor Roger Sahs Assistant Extension Specialist Land Values, Rents, Rent to Value Ratios and Land as an Investment
A new website, aglease.info & a reminder about aglease101.org
Sources of data • Land values • USDA National Ag Statistics Service annual summary • Agecon.okstate.edu/oklandvalues • Kansas City Federal Reserve Bank quarterly Ag Credit Survey • Rental rates • OSU survey results in CR-216 and CR-230 • USDA NASS annual statistics • Oklahoma Commissioners of the Land Office
Farm Real Estate Value, 2012 (% change) -2.2% 10.0% 2.75% -1.5% 7.0% 26.5% 5.0% 20.9% 3.4% 23.9% 7.4% 8.2% -4.5% 10.4% 3.7% -7.7% 4.0% 22.8% 33.5% 5.0% 13.6% -3.5% 17.0% 17.5% NC 5 6.4% NC -1.1% -3.9% 13.7% 19.2% 5.2% 11.50 NC NC 26 1.4% 11.3% 2.9% 9.6% NC 12.0% NC -2.4% -7.9% 0.9% N/C 2.9% <0 9.1% -2.1% 1-9 10-19 > 20 USDA-NASS data
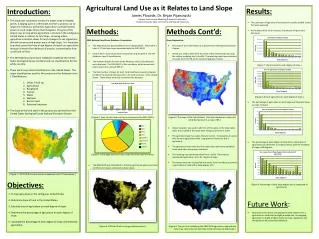
Crop Land Average Value by State, 2012 ($ per acre) 2,230 853 1,350 4,050 2,510 4,230 2,560 2,320 2,600 4,000 1,290 7,300 5,650 12,380 4,480 5,000 7,800 6,200 6,800 N/A 2,690 3,500 1,450 4,700 1,750 3,450 500 - 999 7,000 3,340 9,810 4,000 1,000 – 2,499 3,430 1,390 2,370 2,520 8,500 1,830 2,500 – 4,999 2,070 2,300 3,360 5,000 – 15,000 1,690 5,730 2,120 USDA/NASS data
Crop Land Cash Rent, 2012 ($ per acre) 215 58 29.5 151 130 143 115 94 47 79.5 50.5 108 142 72.5 235 176 68 130 122 175 58.5 N/A 212 33 89.5 72 60.5 49 87 130 25 to 50 110 267 70.5 51 to 100 91 32.5 200 94.5 37.5 74 101 to 150 52 99 98 >151 36 76.5 103 USDA/NASS data
www.agecon.okstate.edu/oklandvalues USDA/NASS data
Average Annual Dryland Cash Rental Rates ($/acre) North central East Northwest Southwest Source: OSU/NASS survey, fall 2012
Pasture Land Average Value by State, 2012 ($ per acre) 810 570 490 620 1,500 2,130 1,210 590 1,250 2,500 450 2,600 3,000 660 3,200 2,600 3,100 13,500 N/A 920 640 2,100 2,800 4,100 950 1,820 500 - 999 2,450 4,400 3,580 1,000 – 2,499 1,150 950 2,300 350 2,850 2,500 – 4,999 1,930 1,550 4,200 5,000 – 15,000 1,560 2,300 4,300 USDA/NASS data
Average Pastureland Rent, 2012 ($ per acre) 5.90 24.50 14 17.50 34 4.80 46 38 17.50 35 N/A 5 4.60 21 28 16.50 0 to 5 11.50 26 5 to 14 20 11.50 2.80 15 to 24 19 28 16 25 to 50 6.50 18 12.50 USDA/NASS data
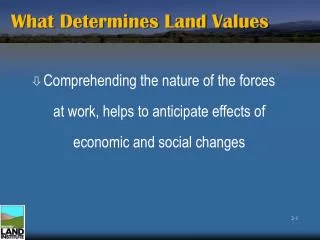
OK Pasture Land Values as a Percent of Cropland Values http://agecon.okstate.edu/oklandvalues/
Average Annual Pasture Cash Rental Rates ($/acre) North central Northwest East Southwest Source: OSU/NASS survey, fall 2012
2009-2011 Cropland and Pasture Values by Size of Tract http://agecon.okstate.edu/oklandvalues/