Download
1 / 1
10 likes | 361 Vues
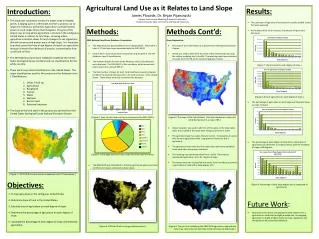
Agricultural Land Use as it Relates to Land Slope. Results: The calculation of agricultural land times the results yielded results that were expected. As the slope of the land increases, the amount of agriculture decreases . (Figure 7: the land area for each degree of slope.)

E N D
Agricultural Land Use as it Relates to Land Slope • Results: • The calculation of agricultural land times the results yielded results that were expected. • As the slope of the land increases, the amount of agriculture decreases . • (Figure 7: the land area for each degree of slope.) • (Figure 8: Area of agriculture on each degree of slope.) • The percentage of agriculture on each degree of slope decreases as slope increases. • The percentage of each degree of slope that is comprised of agriculture also decreases as slope increases, with the exception of slope at 10 degrees. • (Figure 9: Percentage of each slope degree that is comprised of agriculture.) • Future Work: • Future work will consist of mapping the areas where there is agriculture on land that has highly erodible soil. By mapping agriculture on highly erodible land and slope, regulations and standards can be created and enforced. • Introduction: • This study was conducted as part of a larger study on tipping points. A tipping point is a threshold at which a process can no longer be reversed or prevented. Agriculture is predominantly grown on land slopes of less than 8 degrees. The goal of this project was to map where agriculture is located in the contiguous United States in relation to land slope. Knowing where agriculture is located allows for land managers to set regulations that will conserve and protect areas of high slope. It is important to protect areas that have a high degree of slope from agriculture because it lessens the likelihood of erosion, contamination from runoff and soil loss. • The 2001 National Land Cover Database created by the United States Geological Survey contains land use classifications for the whole country. • There are 8 major land classifications in the United States. The major classifications used for this project are the Anderson Level 1 Classifications. • Urban / Built-up • Agricultural • Rangeland • Forests • Water • Wetland • Barren Land • Perennial Ice/snow • The slope of the land used in this project was derived from the United States Geological Survey National Elevation Dataset. • Objectives: • To map agriculture in the contiguous United States. • Determine slope of land in the United States. • Calculate area of agriculture on each degree of slope. • Determine the percentage of agriculture on each degree of slope. • Calculate the percentage of each degree of slope dominated by agriculture. James Plourde, Dr. Bryan Pijanowski Human-Environment Modeling & Analysis Laboratory Purdue University Dept. of Forestry and Natural Resources • Methods: • 2001 National Land Cover Database Preparation: • The 2001 NLCD was downloaded from the USGS website. There were a total of 17 land use classes associated with the 2001 NLCD. • Each of the 17 land classes were reclassified using ArcGIS 9.3 into the Anderson Level 1 classifications. • The number of pixels for each of the Anderson Level 1 classifications was calculated. The 2001 NLCD is 30m resolution, which means each pixel is equal to an area of 900 m2. • The total number of pixels for each land classification were multiplied by 900 m2 to calculate the total area in for each land class in the United States. These values were then converted into hectares. • (Figure 2: Area of each land use class in hectares for the 2001 NLCD ) • (Figure 3: Percentage each land class comprises of the total land area.) • The 2001 NLCD was reclassified so that only agriculture was present and all other land classes contained no data values. • (Figure 4: 2001 NLCD with only agriculture present. ) • Methods Cont’d: • Slope Preparation: • The slope of the United States was derived from the National Elevation Dataset. • ArcGIS was used to determine the slope of the United States by using the surface modeling tool in ArcGIS. The resulting raster layer consisted of values from 0 to 88, which represent degrees of slope. • (Figure 5: The slope of the United States. Dark blue represents a slope of 0, while Red represents a slope of 88. ) • Raster calculator was used to add 1 to all the values in the slope raster layer. This resulted in the raster layer having values from 1 to 89. • The agriculture layer has values that are 0 and 1. 0 represents all values that are none agriculture while 1 represents all land area that is agriculture. • The agriculture raster layer and the slope raster layer were multiplied times each other using raster calculator. • The resulting map contained values from 1 to 89. These values represented agriculture areas for degree of slope. • The values were then reclassified into values from 0 to 88 because there is agriculture on land with a slope degree of 0. • (Figure 6: The result of multiplying the 2001 NLCD agriculture map with the slope map. Blue areas are low slope, while red areas are high slope. ) ( Figure 1: 2001 NLCD land use classes in Anderson Level 1 Classification. )