Water Unit Introduction
230 likes | 253 Vues
Explore the unique chemistry of water, its distribution on Earth, and the effects of global warming on the hydrologic cycle. Learn about the hydrologic cycle, ocean circulation, and the special properties of water that make it essential for life. Discover how water mediates chemical reactions, impacts climate, and plays a crucial role in global precipitation trends.

Water Unit Introduction
E N D
Presentation Transcript
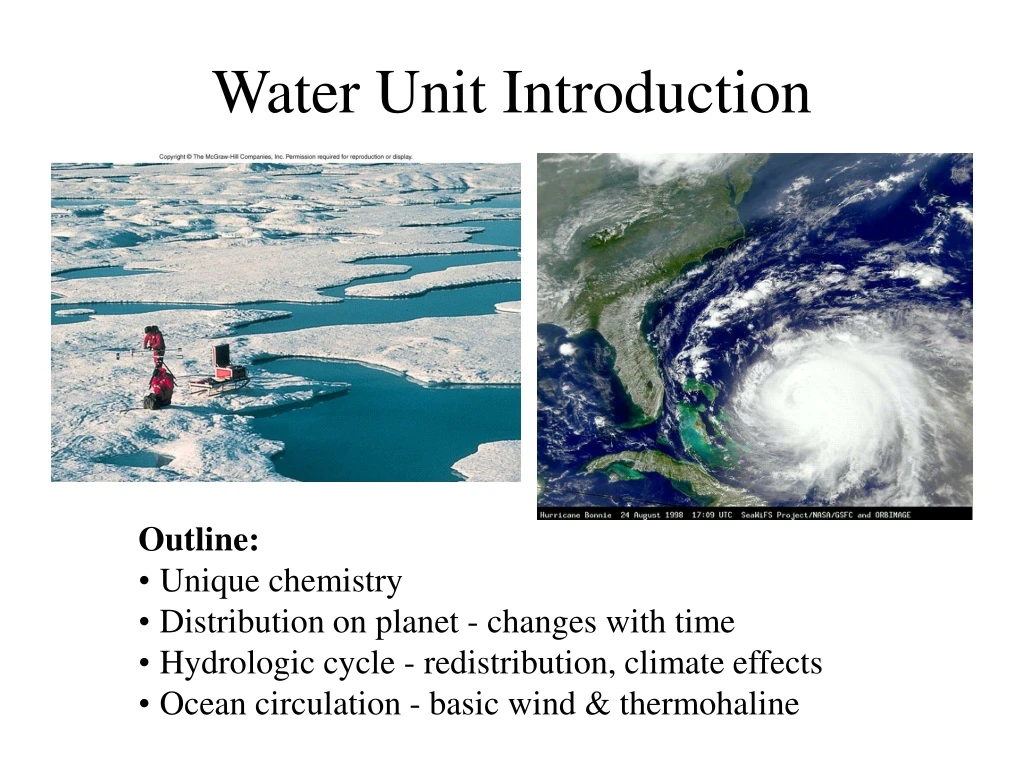
Water Unit Introduction • Outline: • Unique chemistry • Distribution on planet - changes with time • Hydrologic cycle - redistribution, climate effects • Ocean circulation - basic wind & thermohaline
Chemically unique because it: • exists in all three phases at atmospheric temp & pressure (high melting and boiling points for size & bond type- ammonia-NH3-mass 17, MP -78, BP 33) and is theonly substance that does this! • has covalent bonds for molecule, hydrogen bonds for liquid/solid phase (10x stronger than usual inter-molecular bonds, but weaker than metal or ionic bond)
Chemically and physically unique because it has: • high heat capacity - 4.2 J/g/K- i.e., takes more energy to raise temp, therefore stores more, important for spreading planet’s heat • high heat of fusion (solid <> liquid ~ 335 J/g/ºK) and vaporization (liquid <>gas ~ 2400 J/g/ºK) so more effectively transfers heat when changing phase in atmosphere/ocean • conducts heat more readily as a liquid
Water is chemically and biologically unique because it: • has high surface tension so forms drops & helps make good cell membranes • can dissolve other compounds very easily (most common solute), so can transport many things, e.g. NaCl, nutrients • mediates or facilitates most chemical reactions in living systems (e.g., takes water to photosynthesize) - neutral pH
Water is physically unique because it is less dense as a solid (ice) than as a liquid.
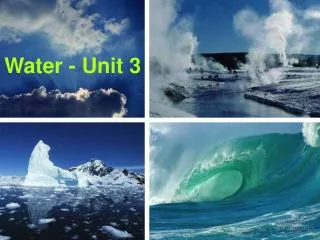
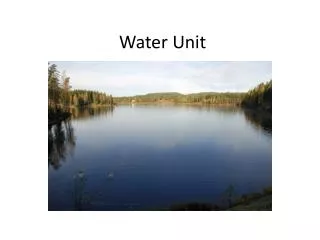
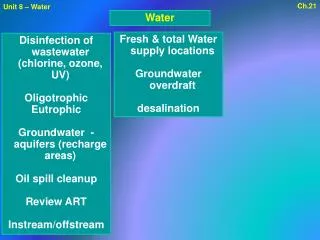
Distribution on Earth “Water, water everywhere, nor any drop to drink.” – Coleridge, Rime of the Ancient Mariner
Effects of global warming on water cycle Global warming (temperature increase) Speeds up global water cycle • More extreme weather events • Droughts • Storms • Floods
Projected Changes in Annual Precipitation for the 2050s The projected change is compared to the present day with a ~1% increase per year in equivalent CO2 Source: The Met Office. Hadley Center for Climate Prediction and Research
Global Precipitation Trends (% per decade) 1900 - 1994 Green•= increasing, Brown•= decreasing Source: Watson 2001
U.S. Precipitation Trends: 1901 to 1998 Green•= increasing, Brown•= decreasing All stations/trends displayed regardless of statistical significance Source: National Climatic Data Center/NESDIS/NOAA
Extreme Precipitation Events in the U.S. Source: Karl, et.al. 1996.