Download

1 / 16
160 likes | 271 Vues
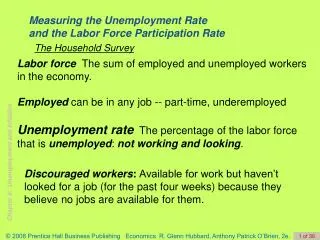
Disentangling the unemployment rate in the Romanian economy. MSc. student Vlad Muscalu Professor Mois ă Altăr. Introduction. Statistical approaches time series estimations Kalman filter unemployment rate – price growth relationship SVAR model

E N D
Disentangling the unemployment rate in the Romanian economy MSc. student Vlad Muscalu Professor Moisă Altăr
Introduction • Statistical approaches • time series estimations • Kalman filter • unemployment rate – price growth relationship • SVAR model • allows data to determine how demand and supply shocks diffuse over time – employs the most economic theory reasoning
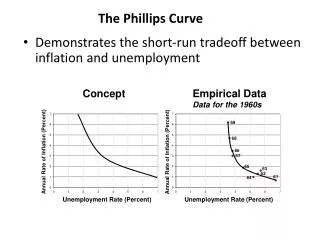
Introduction • Philips curve: • Gordon (1990)
Introduction Plotting a 1998-2007 Philips Curve for the Romanian economy
Data • Consumer price inflation • Registered unemployment rate • Industrial production • Capacity utilization • International oil prices
A Kalman filter approach • The model
A Kalman filter approach • The model
A SVAR approach • Imposing long-run restrictions
A SVAR approach • Expected response of unemployment to positive shocks: • Oil shocks ↑ • IS shocks ↓(LR=0) • Technology shocks ?(LR=0) • Unemployment shocks ↑ • LM shocks ↓(LR=0)
A SVAR approach • Expected response of unemployment to positive shocks: • Oil shocks ↑ • IS shocks ↓(LR=0) • Technology shocks ?(LR=0) • Unemployment shocks ↑ • LM shocks ↓(LR=0)
A SVAR approach • Unemployment gap: • NAIRU:
A SVAR approach • SVAR determined NAIRU
Conclusion • The approaches employed to estimate the NAIRU yield diverging results • Both methods imply the unemployment rate has fallen below the NAIRU since mid-2007 • The SVAR approach – which has more economic foundations – suggests the unemployment rate has fallen in excess demand territory for the last 6 years