Download

1 / 9
90 likes | 213 Vues
This document discusses the complexities associated with power rate risks, focusing on various factors influencing revenue variability for the Bonneville Power Administration (BPA). It highlights the impact of hydro supply and market price variability, operational costs, and unexpected expenses on net secondary energy sales revenue. Additionally, strategies for mitigating risks, such as adjusting rate structures and maintaining cash reserves, are explored. Insights are drawn from a workshop led by Roy Fox, BPA Enterprise Risk Manager, held on January 28, 2005.

E N D
Fish Cost Components WorkshopPBL Rate Case Risksand Risk Mitigation Background and discussion Roy Fox, BPA Enterprise Risk Manager January 28, 2005 Pre-decisional page 1 (for discussion only)
Pre-decisional page 2 (for discussion only)
MID-C MONTHLY AVERAGE PRICES FOR HLHMAY 1996 – MAY 2004 Price ($/Mwh) Pre-decisional page 3 (for discussion only)
Net Secondary Energy Sales Revenue Variability • Hydro and market price variability combine to create huge net secondary sales revenue uncertainty: • 2005 and 2006 PBL net sec. sales rev. ~ $500m with a std. dev. of ~$300m (August 18th Workshop) • Average market prices used (Aug. ’04 SNCRAC assumptions): $39 - $44 per MWh 2005-6 Std. Dev. $14 • Risk level varies with market price assumptions Pre-decisional page 4 (for discussion only)
Drivers of Power Rate Risks Drivers of Power Rate Risks • Hydro supply variability (both annual volume and seasonal shape of run-off) • Market price variability (level and volatility) • Fish and Wildlife costs from generation changes resulting from non-power requirements for operations • CGS performance • Other resource availability (wind, conservation, hydro plant performance and availability) • Loads • Unexpected expenses, expense overruns (“non-operating” risks) • IOU Settlement cost variability Pre-decisional page 5 (for discussion only)
TPP: Treasury Payment Probability • As a not-for-profit, Federal enterprise, BPA does not seek to maximize net revenue; BPA must use other financial performance measures. • Key performance – making all scheduled payments to Treasury on time. • High probability of making payments to Treasury has become a key financial metric. • BPA must pay other vendors before paying Treasury; TPP measures overall financial health. Pre-decisional page 6 (for discussion only)
TPP Graph (For illustration purposes only– from June 10th workshop) Pre-decisional page 7 (for discussion only)
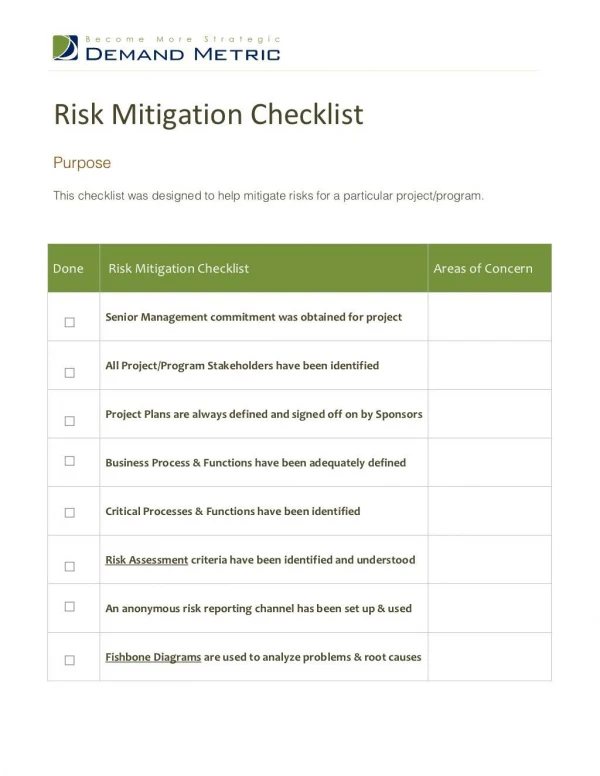
Factors Affecting TPP Currently reserves are the main protection against net revenue variability. The 4 main factors affecting TPP in a rate case are: • The starting reserve level; • The expected value of the change in reserves from one year to the next (i.e., the E.V. of BPA’s cash flow); • The annual variability (risk) in BPA’s cash flow; • The length of the rate period. Pre-decisional page 8 (for discussion only)
Tools to Mitigate Risks • Cash Reserves • Planned Net Revenues for Risk (increases cash reserves via increase in rates) • Rate Design • Flat rates & reserves • Shaped rates (eg. front-load revenues or back-load costs) • Rebates (send rebates to customers if certain conditions occur) • Surcharges (raise rates if certain conditions occur) • Indexed rates (index the level of rate to a measurable variable) • Potential to engage others to explore risk mitigation alternatives – cost and feasibility issues • Length of rate period (generally less risk with shorter rate periods) Pre-decisional page 9 (for discussion only)