Download
1 / 1
10 likes | 231 Vues
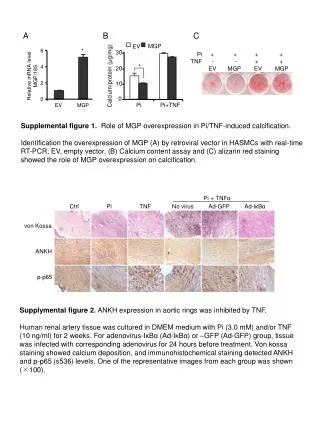
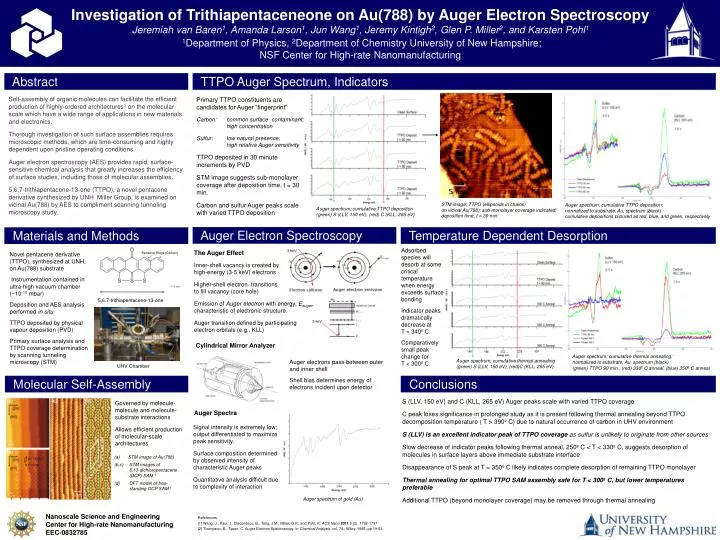
Investigation of Trithiapentaceneone on Au(788) by Auger Electron Spectroscopy Jeremiah van Baren 1 , Amanda Larson 1 , Jun Wang 1 , Jeremy Kintigh 2 , Glen P. Miller 2 , and Karsten Pohl 1 1 Department of Physics, 2 Department of Chemistry University of New Hampshire;

E N D
Investigation of Trithiapentaceneone on Au(788) by Auger Electron Spectroscopy Jeremiah van Baren1, Amanda Larson1, Jun Wang1, Jeremy Kintigh2, Glen P. Miller2, and Karsten Pohl1 1Department of Physics, 2Department of Chemistry University of New Hampshire; NSF Center for High-rate Nanomanufacturing Abstract TTPO Auger Spectrum, Indicators • Self-assembly of organic molecules can facilitate the efficient production of highly-ordered architectures1 on the molecular scale which have a wide range of applications in new materials and electronics. • Thorough investigation of such surface assemblies requires microscopic methods, which are time-consuming and highly dependent upon pristine operating conditions. • Auger electron spectroscopy (AES) provides rapid, surface-sensitive chemical analysis that greatly increases the efficiency of surface studies, including those of molecular assemblies. • 5,6,7-trithiapentacene-13-one (TTPO), a novel pentacene derivative synthesized by UNH Miller Group, is examined on vicinal Au(788) by AES to compliment scanning tunneling microscopy study. Primary TTPO constituents are candidates for Auger “fingerprint” Carbon: common surface contaminant; high concentration Sulfur: low natural presence; high relative Auger sensitivity TTPO deposited in 30 minute increments by PVD STM image suggests sub-monolayer coverage after deposition time, t = 30 min. Carbon and sulfur Auger peaks scale with varied TTPO deposition STM image; TTPO (ellipsoids in chains) on vicinal Au(788); sub-monolayer coverage indicated; deposition time, t = 30 min. Auger spectrum; cumulative TTPO deposition; normalized to substrate, Au, spectrum (black) cumulative depositions pictured as red, blue, and green, respectively Auger spectrum; cumulative TTPO deposition (green)S (LLV, 150 eV), (red) C (KLL, 265 eV) Auger Electron Spectroscopy Temperature Dependent Desorption Materials and Methods Adsorbed species will desorb at some critical temperature when energy exceeds surface bonding Indicator peaks dramatically decrease at T = 340ºC Comparatively small peak change for T < 300ºC The Auger Effect Inner-shell vacancy is created by el high-energy (3-5 keV) electrons Higher-shell electron transitions to fill vacancy (core hole) Emission of Auger electron with energy, Eauger, characteristic of electronic structure. Auger transition defined by participating electron orbitals (e.g., KLL) • Novel pentacene derivative (TTPO), synthesized at UNH, on Au(788) substrate • Instrumentation contained in ultra-high vacuum chamber (~10-10 mbar) • Deposition and AES analysis performed in situ • TTPO deposited by physical vapour deposition (PVD) • Primary surface analysis and TTPO coverage determination by scanning tunneling microscopy (STM) Benzene Rings (Carbon) 5,6,7-trithiapentacene-13-one 3 keV Cylindrical Mirror Analyzer Auger spectrum; cumulative thermal annealing; normalized to substrate, Au, spectrum (black) (green) TTPO 90 min., (red) 330º C anneal, (blue) 350º C anneal Auger spectrum; cumulative thermal annealing (green) S (LLV, 150 eV), (red)C (KLL, 265 eV) Auger electrons pass between outer and inner shell Shell bias determines energy of electrons incident upon detector UHV Chamber Conclusions Molecular Self-Assembly S (LLV, 150 eV) and C (KLL, 265 eV) Auger peaks scale with varied TTPO coverage C peak loses significance in prolonged study as it is present following thermal annealing beyond TTPO decomposition temperature ( T > 390º C) due to natural occurrence of carbon in UHV environment S (LLV) is an excellent indicator peak of TTPO coverage as sulfur is unlikely to originate from other sources Slow decrease of indicator peaks following thermal anneal, 250º C < T < 330º C, suggests desorption of molecules in surface layers above immediate substrate interface Disappearance of S peak at T = 350º C likely indicates complete desorption of remaining TTPO monolayer Thermal annealing for optimal TTPO SAM assembly safe for T < 300º C, but lower temperatures preferable Additional TTPO (beyond monolayer coverage) may be removed through thermal annealing Governed by molecule-molecule and molecule-substrate interactions Allows efficient production of molecular-scale architectures Auger Spectra Signal intensity is extremely low; output differentiated to maximize peak sensitivity. Surface composition determined by observed intensity of characteristic Auger peaks Quantitative analysis difficult due to complexity of interaction STM image of Au(788) (b,c) STM images of 6,13-dichloropentacene (DCP) SAM 1 (d) DFT model of free- standing DCP SAM 1 Auger spectrum of gold (Au) Nanoscale Science and Engineering Center for High-rate Nanomanufacturing EEC-0832785 References [1] Wang, J., Kaur, I., Diaconescu, B., Tang, J.M., Miller, G.P., and Pohl, K. ACS Nano2011 5 (3), 1792-1797 [2] Thompson, B., Tyson, C. Auger Electron Spectroscopy. In Chemical Analysis, vol. 74.; Wiley, 1985; pp 19-53.