Download
1 / 40
400 likes | 648 Vues
The External Environment for Developing Countries July 2009 The World Bank Development Economics Prospects Group. China at the forefront of the global economic recovery industrial production, percent (month-on-month). World. USA. Germany. Source: Thomson/ Datastream , Haver , DECPG.

E N D
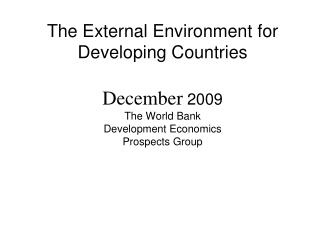
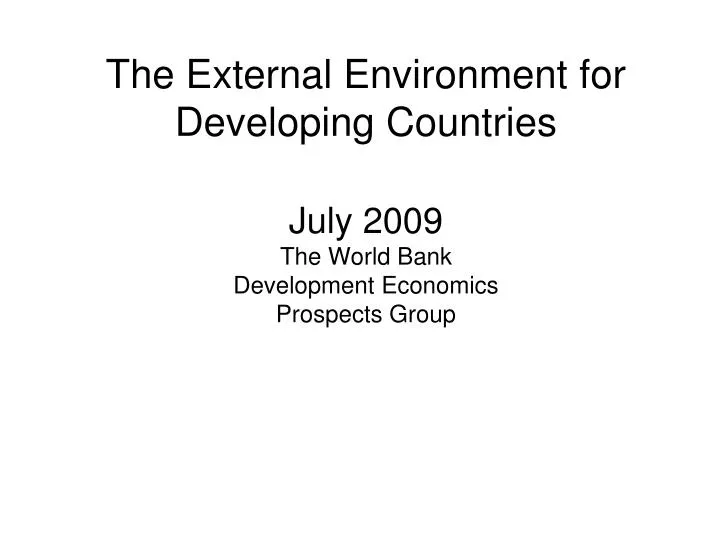
The External Environment for Developing CountriesJuly 2009The World BankDevelopment EconomicsProspects Group
China at the forefront of the global economic recovery industrial production, percent (month-on-month) World USA Germany Source: Thomson/Datastream, Haver, DECPG.
Cross border bank flows to developing countries continue meagrebillions USD, 3-month moving average Syndicated lending Bonds Source: Loanware and Bondware.
Employment losses ease… with potential positive effects on spending retail volume growth (y/y) [L]; change in employment (3mma) [R] Change in employment [R] Retail sales [L] Source: U.S. Departments of Commerce and Labor.
U.S. economic activity is stabilzing…but bank loan charge-offs surgingISM composite economic activity index [left]; Bank charge-offs (% total C&I loans) [right] ISM composite index [left] C&I charge-offs [right] Source: Institute for Supply Management; Federal Reserve Board.
U.S. trade developments may offer boost for 2nd quarter GDP export and import volumes, ch% saar Export volumes Import volumes Source: U.S. Department of Commerce.
Japan’s trade and production take a sharp leg up over May/Juneexport volumes and manufacturing output, ch% saar Export volume Production Source: Bank of Japan and Japan Cabinet Office.
Labor markets deteriorate quicklywhile spending continues to falter unemployment rate (%) [left]; retail sales, ch% yr-on-yr [right] Retail sales [right] Unemployment rate % [left] Source: Japan Cabinet Office.
Japan’s inflation drops well into negative territory Toyko CPI and corporate goods prices, ch%, y/y Headline CPI Corporate goods prices (PPI) Source: Bank of Japan.
European labor markets continue to weaken, but sentiment up on lower CPI unemployment rate (%) [left]; EC consumer sentiment [right] Unemployment rate % [left] Euro Area consumer sentiment [right] Source: EUROSTAT and European Commission.
Euro Area CPI in negative ground HICP headline and core, ch% y/y and EURIBOR (%) EURIBOR Headline HICP HICP-core Source: Eurostat.
Deep peak-to-trough declines in industrial production are now being reversed Source: Thomson/Datastream, DECPG.
China at the forefront of the global economic recovery industrial production, percent (month-on-month) World USA Germany Source: Thomson/Datastream, Haver, DECPG.
Global manufacturing looking up Source: JPMorgan-Chase
World export growth appears to be bottomingexports, ch% seasonally adjusted annual rates (saar) Source: World Bank data.
Global imbalances ease moderately as U.S. deficit and China surplus narrowgoods trade balance, U.S. $-bn, seasonally adjusted, annualized China United States Source: National Agencies through Thomson/Datastream.
Eurozone exports begin to support more moderate declines in productionIP and exports, ch% seasonally adjusted annual rates (saar) Industrial Production Exports Source: Eurostat.
Oil prices and OECD oil stocks million bbl $/bbl Source: IEA and DECPG Commodities Group.
World Oil Production (mb/d) Non-OPEC Non-OPEC x FSU OPEC Source: IEA and DECPG Commodities Group.
WTI Futures Prices - NYMEX Monthly contract prices to Dec 2014* for select dates in 2009 $/bbl Jun 11 Jul 13 Feb 18 Source: NYMEX.
Food prices edged higher in June (2000=100) Source: DECPG Commodities Group.
Metals prices ease following large gains in first-half 2009 Copper Nickel Aluminium Source: LME and DECPG Commodities Group.
Freight rates fall on slowdown in bulk trade Source: Datastream and DECPG Commodities Group.
Flows slowed in June; first-half volumes halved from a year earlier Source: DECPG Finance Team.
Cross border bank flows remain well below the levels seen in previous yearsbillions USD, 3-month moving average Syndicated lending Bonds Source: Loanware and Bondware.
EM assets rebound from recent correctionsMSCI equity index, USD [left]; EM bonds spreads, bps [right] EMBIG spreads [right] MSCI equity index [left] Source: Morgan-Stanley and JPMorgan-Chase.
Dollar weakens vs yen… trading range around $1.40 against euro USD per Euro (inverse) [Left] and Yen per USD [right] yen/USD USD/Euro (inverse) Source: Thomson/Datastream.
Dollar slips vs EM currencies in seconed quarterpercentage change (USD per LCU) (%) Stronger Local Currency First quarter 2009 Second quarter 2009 Source: Thomson/Datastream.
Real effective exchange rates depreciate in most of the world’s largest economiesJanuary 2008 = 100 Japan China Euro Area USA Source: Thomson/Datastream, Haver, DECPG.
Real effective appreciation for commodity exporters’ as commodity prices stage a comebackJanuary 2008 = 100 Brazil Australia Canada South Africa Source: Thomson/Datastream, Haver, DECPG.
REERs bounce off lows of early 2009 in countries exporting capital goods and autos BIS effective exchange rate, broad Indices ,January 2008 = 100 Hungary Czech Republic South Korea Source: Bank for International Settlements.
The External Environment for Developing CountriesJuly 2009The World BankDevelopment EconomicsProspects Group