Australia's Economic and Socio-Cultural Environment
Explore the economic growth, demographics, political-legal factors, and socio-cultural aspects shaping Australia's business landscape. Gain insights into technology impact and global market influences for strategic planning.

Australia's Economic and Socio-Cultural Environment
E N D
Presentation Transcript
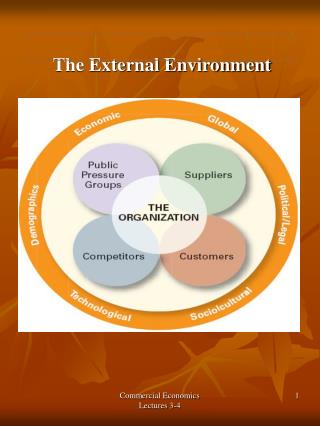
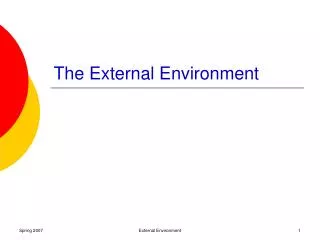
The External Environment Hanson & Dowling Chapters 2
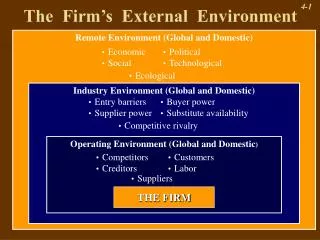
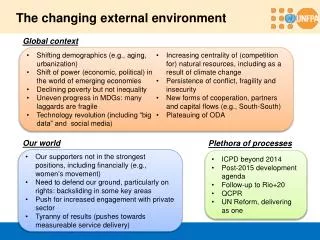
GENERAL ENVIRONMENT Demographic INDUSTRY ENVIRONMENT Economic Socio- Cultural New Entrants Suppliers Customers Substitutes Traditional Rivals Political Legal Global Technological
External Environmental Analysis • Scanning Identifying early signals of changes • Monitoring Detecting meaning through ongoing observation of changes • Forecasting Developing projections of anticipated outcomes • Assessing Determining effect of changes upon firm’s strategy
Economic • Growth • Related economies • Open trade policies • Economic regulation • National infrastrucure
Economic Growth • Economic growth affects individual firms, but they have no control over it • Economic growth: • USA 4.1% (1995–9) • Australia 3.4% (1989–9) • UK 1.9% (1989–9) • Germany 0.6% (1989–9)
Australia’s Two Economies • In the ‘global’ cities of Sydney and Melbourne, unemployment is low and incomes are rising • In country areas, unemployment is high (over 10% on average) and property values are falling • In 1996, the average nett household wealth • for the Mersey-Lyell region of Tasmania was $87,314 • in 12 middle-class harbourside Sydney suburbs was $393,381
Demographics • Population Size • Age Structure • Geographic distribution • Ethnic mix • Income distribution
Australia’s Ageing Population • In June 1998, 12% (2.3 million) of the Australian population was aged over 65: • Only 6% in the labour force • Only 58% held superannuation • By 2051, 24% of the population will be 65 or over • Challenges: • Income support • Health infrastructure
Declining Birth Rate • Replacement rate for a population is 2.1 • The birth rate in Australia in 1998 was 1.76 • Declining birth rate in the western world: • US birth rate 2.0 • NZ birth rate 2.0 • British birth rate 1.70 • German birth rate 1.5 • Italian birth rate 1.2
Politico-Legal Segment • Government regulations • Government charges • Legal system • Rule of Law • Government support • Commitment to attaining a national competitive advantage
Socio-cultural Segment • Work Habits • Savings • Social Welfare & Health • Environmental concerns • Religion • Educational standards • Workforce diversity
Gender Wages Rates • Pay differentials still exist between men and women all over the world • Men earn: • 34% more than women in the UK • 17% more in Sweden • 24% more in Australia
Technology • Innovation • Telecommunications infrastructure • Internet • Intellectual property
Global Segment • New global markets • International political events • Global market integration • International Treaties (e.g. WTO)
Porter’s 5 forces Substitute Products New Entrants Traditional Competitors The firm Suppliers Customers
New Entrants: Barriers to Entry • Economies of Scale • Product Differentiation • Capital Requirements • Switching Costs • Access to Distribution Channels • Cost Disadvantages Independent of Scale • Government Policy • Expected Retaliation
Bargaining Power of Suppliers • Suppliers exert power in the industry by threatening to raise prices or reduce quality • Powerful suppliers can squeeze industry profitability if firms are unable to recover cost increases
Bargaining Power of Suppliers (cont.) • Suppliers will be powerful if: • Supplier industry is dominated by a few firms • Supplier’s products have few substitutes • Buyer is not an important customer to the supplier • Supplier’s product is important to the buyer’s product • Supplier products are differentiated • Supplier’s products have high switching costs • Supplier poses a credible threat of forward integration
Bargaining Power of Buyers • Buyers compete with the supplying industry by: • Bargaining-down prices • Forcing higher quality • Playing firms off against each other
Bargaining Power of Buyers (cont.) Buyer groups are likely to be powerful if: • Buyers are concentrated or purchases are large relative to the seller’s sales • Purchase accounts for a large part of the supplier’s sales • Products are undifferentiated • Buyers face few switching costs • Buyer’s industry earns low profits • Buyer presents a credible threat of backward integration • Product is not important to quality • Buyer has full information
Threat of Substitute Products • Products with similar function limit the prices firms can charge • Products with improving price/performance tradeoffs relative to present industry products eg • Electronic security systems in place of security guards • Fax machines in place of overnight mail delivery
Rivalry among Existing Competitors • Jockeying for strategic position • Using price competition • Staging advertising battles • Increasing consumer warranties or service • Making new product introductions
Rivalry among Existing Competitors • Intense rivalry occurs when a firm is pressured or sees an opportunity • Price competition often leaves the entire industry worse off • Advertising battles may increase total industry demand, but may be costly to smaller competitors
Rivalry among Existing Competitors • Cut-throat competition is more likely to occur with: • Numerous or equally balanced competitors • Slow-growth industry • High fixed costs • High storage costs • Lack of differentiation or switching costs • Capacity added in large increments • Diverse competitors • High strategic stakes • High exit barriers
Rivalry among Existing Competitors • High exit barrierscan include: • Specialised assets • Fixed cost of exit (e.g. labour agreements) • Strategic interrelationships • Emotional barriers • Government and social restrictions
Effects of Entry and Exit Barriers on Industry Profits Exit Barriers Low High Low, Stable Returns Low, Risky Returns Low Entry Barriers High, Stable Returns High, Risky Returns High
Competitor Analysis • What drives the competitor? • What can the competitor do? • What does the competitor believe about itself and the industry? • What are the competitors capabilities? • What will the competitor do in the future? • Where do we have a competitive advantage? • How will this change our relationship with our competition?
The Internal Environment Hanson & Dowling Chapter 3
Key Questions in Internal Analysis • How do we assemble bundles of resources, capabilities and core competencies to create value for customers? • Will environmental changes make our core competencies obsolete? • Are substitutes available for our core competencies? • Are our core competencies easily imitated?
Key Questions in Internal Analysis • Complicated by • Uncertainty • Complexity • Inter-organisational conflicts
Competitive Advantage Discovering Core Competencies Gained through Core Competencies Strategic Competitiveness Above-Average Returns Core Competencies Sources of Competitive Advantage Capabilities Value Criteria of Chain Sustainable Teams of Resources Analysis Advantages Resources * Valuable * Tangible * Rare * Intangible Costly to Imitate * * Non-substitutable
Resources • Tangible • Financial • Physical • Human Resources • Organisational • Intangible • Technological • Innovation • Reputation (Brand power)
Brand Power • Brands can provide a company with competitive advantages • Country Road uses a brand to market a range of crockery, tea towels, napkins and vases as well as clothes • The Harley Davidson name also adorns: • A limited-edition Barbie Doll • A restaurant in New York • A line of L’Oreal cologne
Knowledge Management • Knowledge is spread widely across all employees, organisations and industry settings • Many companies are now creating the new position of Chief Learning Officer (CLO) • The CLO is responsible for determining how a firm should manage knowledge to derive maximum competitive value from it • In the USA, 78% of companies have indicated they are moving towards becoming knowledge-based enterprises
Capabilities • The firm’s capacity or ability to integrate individual firm resources to achieve a desired objective • Develop over time as a result of complex interactions that take advantage of the interrelationships between a firm’s tangible and intangible resources and which are based on the development, transmission and exchange or sharing of information and knowledge as carried out by the firm's employees
Capabilities (cont.) • Become important when they are combined in unique combinationsthat create core competencies which havestrategic valueand which can lead tocompetitive advantage
Core Competencies • What a firm does that is strategically valuable • The essence of what makes an organization unique in its ability to provide value to customers • McKinsey & Co. recommend identifying three to four competencies to use in framing strategic actions
Core Competencies • It must be: • Valuable • Rare • Costly to imitate • Non-substitutable
Costly to Imitate Non-sub-stitutable Competitive Consequences Performance Implications Valuable Rare Below Average Returns Competitive Disadvantage NO NO NO NO Competitive Parity Average Returns YES NO NO YES/NO Temporary Competitive Advantage Aver./Above Average Returns YES YES NO YES/NO Sustainable Competitive Advantage Above Average Returns YES YES YES YES
Core Competencies Costly to Imitate • Unique Historical ConditionsAn unusual evolutionary pattern of growth may contribute to the development of competencies in a manner unique to those particular circumstances • Causal AmbiguityCompetitors are unable to detect how a firm uses its competencies as a foundation for competitive advantage
Core Competencies Costly to Imitate • Social complexityA firm’s capabilities are the result of complex social phenomena, such as interpersonal relationships, trust and friendships among managers or a firm’s reputation with suppliers and customers
Porter’s Value Chain Model • Production consists of a series of activities that add a margin of value to a firm’s products or services • The added value increases profits, enhances asset value and competitive position • Primary activities • Directly related to production and distribution • Support activities • Make delivery possible • Include organisational structure, HR, technology and procurement
Value Chain Analysis identifies which resources and capabilities can add value Firm Infrastructure Human Resource Management Support Activities MARGIN Technological Development Procurement Service Marketing & Sales Outbound Logistics Inbound Logistics MARGIN Operations Primary Activities
Porter’s Value Chain Model • Increase profits by: • Increasing steps that involve primary activities • Reducing steps that involve support activities • Converting support activities to primary activities
To capitalise on the usefulness of the Value Chain concept it is important to recognise that Value Chains are part of a:: Total Value System Supplier Value Chain Firm Value Chain Channel Value Chain Buyer Value Chain
Total Value System Firm Value Chain Channel Value Chain Buyer Value Chain Supplier Value Chain Upstream ValuePerform valuable activities that complement the firm’s activities
Total Value System Supplier Value Chain Firm Value Chain Buyer Value Chain Channel Value Chain Each firm must eventually find a way to become a part of some buyer’s value chain
Total Value System Supplier Value Chain Firm Value Chain Channel Value Chain Buyer Value Chain Ultimate basis for differentiation is the ability to play a role in a buyer’s value chain This creates VALUE!!
Outsourcing • Firms often purchase a portion of their value-creating activities from specialty external suppliers who can perform these functions more efficiently
Strategic Rationales for Outsourcing • Improve Business Focus • Provide Access to World-Class Capabilities • Accelerate Business Re-Engineering Benefits • Share Risks • Free Resources for Other Purposes