Comprehensive Model for Assessing Healthcare Accessibility
This model incorporates four key factors - Population, Health, Barriers, and Ability to Pay - to evaluate underserved areas based on weighted criteria. It includes expert and statistical weighting approaches, as well as identification of barriers like poverty and health disparities.

Comprehensive Model for Assessing Healthcare Accessibility
E N D
Presentation Transcript
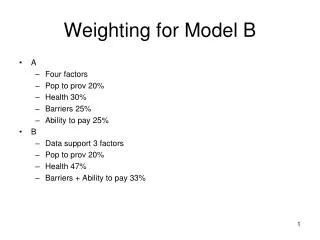
Weighting for Model B • A • Four factors • Pop to prov 20% • Health 30% • Barriers 25% • Ability to pay 25% • B • Data support 3 factors • Pop to prov 20% • Health 47% • Barriers + Ability to pay 33%
CURRENT MEDICALLY UNDERSERVED AREA/POPULATION CRITERIA • Components - Rational Service Area (RSA) • Criteria and Weighted Values - Percent of Population at 100% Poverty - Percent Population > 65 - Infant Mortality Rate - Primary care physicians per 1,000 Population • Index of Medical Underservice - Value must be < 62.0
Draft MUA Models • A1 • Expert weighting • Choice of any 2 barriers • A2 • Expert weighting • Choice of 2 barriers, one from two buckets • B • Statistical weighting
MUA A1 • P2P 20% • Health Status 30% • 50%SMR 70% + LBW or Diabprev 30% • 50%SDI (Pov 50%, Nonemployed 30%, Sing Parent HH 10%, <HS educ 10%) • Barriers 25% • Highest 2 factors, each 50% • Ability to Pay 25% • Pct Pop Uninsured & <400% poverty
MUA A2 • P2P 20% • Health Status 30% • 50%SMR 70% + LBW or Diabprev 30% • 50%SDI (Pov 50%, Nonemployed 30%, Sing Parent HH 10%, <HS educ 10%) • Barriers 25% • 2 factors, pick 1 from each list each 50% (risk & direct) • Ability to Pay 25% • Pct Pop Uninsured & <400% poverty
Barriers Buckets • Bucket 1 (risk) • LEP or Hispanic • Racial minority • Pop Density • & Disability • Bucket 2 (direct) • Amb Care Sensitive Conditions (Mcare) • % Pop no usual source of care
MUA B • Factor analysis 3 components • Pop to Provider • Health Status • SMR, LBW, Diab, Amb Care Conditions for Medicare pop, SDI4 (%pop <pov, %pop not employed, % pop single parent, % pop <HS) • Barriers & Ability to Pay • % pop uninsured & <400% pov, % pop LEP, % pop racial minority
MUA B • Final step is to rank all service areas based on these three factors and identify the worst quarter of the service areas