Download
1 / 37
370 likes | 568 Vues
The United States air transportation network analysis. Dorothy Cheung. Introduction. The problem and its importance Challenges Missing pieces Previous Studies Related works Key components of my research. Outline. The problem and its importance Challenges Missing pieces

E N D
The United States air transportation network analysis Dorothy Cheung
Introduction • The problem and its importance • Challenges • Missing pieces • Previous Studies • Related works • Key components of my research
Outline • The problem and its importance • Challenges • Missing pieces • Previous Studies • Related works • Key components of my research
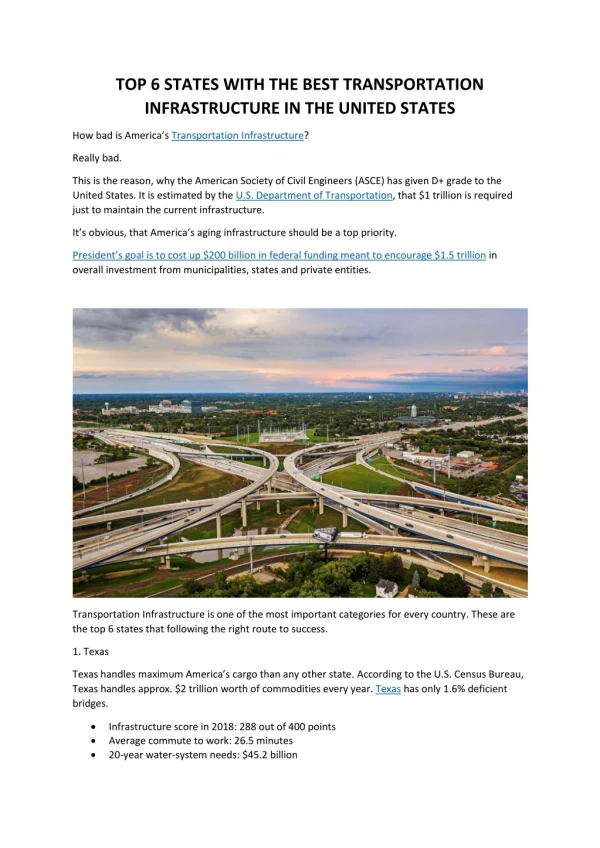
The problem and its importance • Problem • Analysis the air transportation network in the U.S. • Network driven by profits and politics • Better understand the network structure not maximize utility • Importance • Economy: transport of good and services • Air traffic flow: convenience • Health studies: propagation of diseases
Outline • The problem and its importance • Challenges • Missing pieces • Previous Studies • Related works • Key components of my research
Challenges • Large scale and dynamic • Number of daily flights in the continental U.S. ~order of 100,000 [4]. Even back in 1991!!
Outline • The problem and its importance • Challenges • Missing pieces • Previous Studies • Related works • Key components of my research
Missing pieces • Sufficient amount of researches on the network with focuses on utility optimization. • Commercial enterprises: OAG and Innovata • But … lack of research on analyzing the network features studied in class.
Outline • The problem and its importance • Challenges • Missing pieces • Previous Studies • Related works • Key components of my research
Previous studies • No analysis on the network features related to this class. • Related studies for reference and metrics to analyze.
Outline • The problem and its importance • Challenges • Missing pieces • Previous Studies • Related works • Key components of my research
Related worksAir transportation networks analysis • WAN – World-wide Airport Network • ANI – Airport Network of India • ANC – Airport Network of China
WAN • Network • Nodes: cities • Edges: flight routes • Data • OAG • November 1, 2000 to November 7, 2000 • Four years gap • Scheduled flights from all airlines
WAN • Small world property • Comparison to a random WAN • Shortest path length 4.4. Worst case is 15. • High clustering coefficient 0.62 (WAN) vs. 0.049. • Power law cumulative degree distribution • Tail of degree distribution monotonically decreases (preferential attachment) • Alpha 1.0. Size of network increases so does the degree of the nodes.
WAN • Cumulative distribution of normalized betweeness plotted in log-log scale [1]. • Power law exponent 0.9+/- 0.1. • Randomized power law exponent 1.5 +/- 0.1.
WAN • Most connected versus must central (betweenness centrality) cities [1]. • Circle represents WAN • Dotted line represents a randomized WAN • Smaller degree nodes higher betweenness • Small degree nodes are more central: Anchorage in Alaska
WAN Identify most connected and most central cities. • (b) Top 25 most connected cities [1]. • (c) Top 25 most central cities (betweenness)[1].
WAN • Identify communities to better understand why nodes with smaller degree have high centralities [1]. • Simulated annealing algorithm. • Communities in WAN. Each color represents a community. • India grouped with the counties in Northeastern Africa.
WAN • Identify hubs in WAN [1]. • z >= 2.5 are hubs and z < 2.5 non hubs (RB) Majority of hubs are well connected within their communities. (c) Non hub (G), hub(Y) and connector hubs (Gy) Cities that are not hubs rarely have links to other communities.
ANI • Network • Nodes: airports • Un-weighted edges: existence of flight routes • Weighted edges: amount of flight routes per week • 79 nodes with 6162 distinct paths • Data • Timetable for air services in India. • Week of January 12, 2004.
ANI • Small world property • Shortest path length 4. Worst case is 6. • Comparison to a random ANI. High clustering coefficient 0.6574 (ANI) vs. 0.0731 (random). Shortest path distribution [2].
ANI • Power law cumulative degree distribution • Tail of degree distribution monotonically decreases. • Alpha 2.2 +/- 0.1. Size of network increases so does the degree of the node. Cumulative degree distribution in log-log scale [2].
ANI Skewed distribution on the right [2]. • Average strength [2]. • The larger the airport the more traffic it handles.
ANI • Large airports provide air connectively to smaller airports. • Large airports tend to be disconnected. • Rich-club phenomena Average un-weighted c(k) and weighted Cw(k) clustering coefficients [2].
ANI • Larger the degree less correlated. • Dissociative mixing Large airports connect with smaller airports Average unweightedknn(k) and weighted knnw(k) degree of nearest neighbors of nodes with degree k [2].
ANC • Network • Nodes: airports • Un-weighted edges: existence of flight routes • 128 airports (nodes), 1165 flights (edges) • Data • Timetable for air services in China • A week of data (dates not specified)
ANC • Small world property • Shortest path length 2.067. • Comparison to a random ANC. High clustering coefficient 0.733 (ANC) vs. 0.143 (random).
ANC • Power law cumulative degree distribution • Weights accounts for frequency of flights. • Tail of degree distribution monotonically decreases. • Alpha 1.65. Cumulative weight distributions of the entire week [3].
ANC • Degree-degree correlations showing disasociative mixing [3].
ANC • (A) diameter vs. density of undirected ANC [3]. • (B) efficiency vs. density of undirected ANC [3].
Summary: Features of air transportation networks • Small world network (compared with random graphs) • Small average shortest path • High average clustering coefficient • Degree mixing differs • Scale free power law degree distribution
Outline • The problem and its importance • Challenges • Missing pieces • Previous Studies • Related works • Key components of my research
Key components of my approach • Data set from Research and Innovative Technology Administration (Bureau of Transportation Statistics • Flights scheduled • Passengers and Cargos • Published in 06/2011 • Several months
Key components of my approach • Network • Nodes: airports • Un-weighted edges: flights • Metrics • Degree distributions and correlations • Top 10 most connected cities • Top 10 most central cites • Shortest path length • Clustering coefficient • Cumulative degree distribution and the power law • Associativity • Does it exhibit the rich-club phenomena? • Compare between an un-weighted and weighted versions? Random graph?
Key components of my approach • Expectations • Larger degree nodes are more central (betweenness). Consider LAX, SFO, HOU, JFK, etc. • Small world • Scale free power law distribution • Dissociate
Conclusion The United States air transportation network analysis • The problem and its importance • Challenges • Missing pieces • Previous Studies • Related works – WAN, ANI, ANC
References for this presentation 1. R. Guimera, S. Mossa, A. Turtschi, and L.A.N. Amaral, “The world-wide air transportaion network: Anomalous centrality, community structure, and cities’ global roles”, July 2005. 2. Ganesh Bagler, “Analysis of the Airport Network of India as a complex weighted network”, February 2008. 3. W. Li and X. Cai, “Statistical Analysis of Airport Network of China”, September, 2003. 4. Amedeo R. Odoni, “Issues in modeling a national network of airports”, Proceedings of the 1991 Winter Simulation Conference, Cambridge, Massachusetts, Jose J. Ramasco, VittoriaColizza, and PietroPanzarasa, “Using the weighted rich-club coefficient to explore traffic organization in mobility networks”, 1991.