ER Diagrams
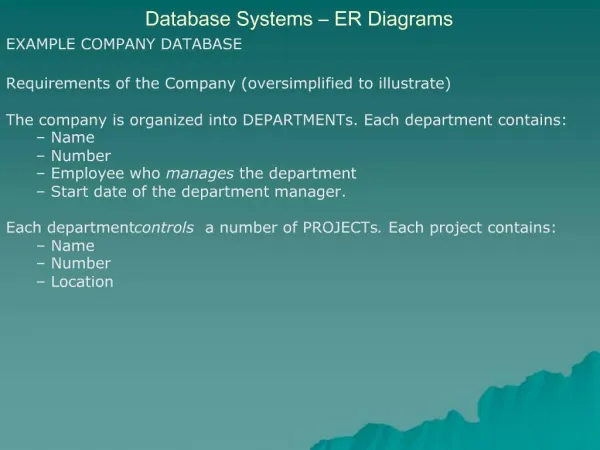
ER Diagrams. CMSC 461 Michael Wilson. Entity-relationship diagramming (ER Diagrams). ER Diagrams are diagrams that can describe relations/databases Meant to be high level Pure concept, no implementation Can help you figure out how to design your relations, choose keys, etc.


ER Diagrams
E N D
Presentation Transcript
ER Diagrams CMSC 461 Michael Wilson
Entity-relationship diagramming (ER Diagrams) • ER Diagrams are diagrams that can describe relations/databases • Meant to be high level • Pure concept, no implementation • Can help you figure out how to design your relations, choose keys, etc. • We’re going to be using Chen diagrams • Keep this in mind when looking up info on the internet
Why devote an entire lecture to a diagramming method? • You can use ER Diagrams to help design your data • Choose keys, figure out where to put what attributes • Handy for trying to picture what you’re really trying to model
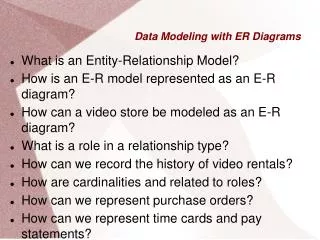
ER Diagram • Diagram of an earlier relation • Square box is an “entity” • Ovals are “attributes” • Entities can be related to one another • We can use ER Diagrams to show the relationship between two entities • Diamonds can show a relationship type
Primary keys • Primary keys can be shown by underlining a particular attribute
Multivalued attributes • Attributes with multiple values are shown using concentric ovals • A multivalued attribute is an attribute that consists of multiple other attributes or values • For example patient name: • First name • Last name
Relationships between entities • These relationships are high level as well • They simply describe, at a conceptual level, how the two entities relate to one another • Relationships are generally plaintext words or sentences • Customer places orders • Bands have members • Programmers develop video games • Relationships are not necessarily between two entities – can be between more
Cardinality • Different “sides” of the relationship can have differing cardinalities • Four different types of cardinalities here: • 1 to 1 • 1 to many • Many to 1 • Many to many
Cardinality • Describing cardinality • One patient can have many patient diagnoses • We represent this by putting a “1” on the side of the relationship attached to Patient and an “N” on the side of the relationship attached to patient records
Weak entities • A weak entity is an entity that depends on another entity to exist • In this case, a patient’s insurance info must be attached to a patient • Therefore, it must reference a patient, and is a weak entity, represented by a double rectangle • This relationship is described as an identifying relationship, represented by a double diamond • Tuples cannot be uniquely identified by attributes alone • Has to have a foreign key
Self referential relationships • Employees report to a manager, who is also an employee • Therefore, the relationship in fact references itself • This is totally kosher
Ternary relationships • Here, an employee can sell multiple games to a customer • These are also valid • Can sometimes reduce ternary relationships into binary relationships as well • These are probably closer to how they would be laid out in your DBMS
Really frustrating thing about diagramming • This applies to more than just ER diagrams, but diagramming in general • There isn’t really one way to do it • If you do some research and find examples, you’ll see a billion different ways • In general, stay consistent in your meanings, define them if you’re unsure • Crow’s foot notation
ER Diagram Links • https://drive.draw.io/ • Drawing tool (more than just ER diagrams) • http://creately.com/blog/diagrams/er-diagrams-tutorial/ • http://en.wikipedia.org/wiki/Entity%E2%80%93relationship_model • Wikipedia’s page is very good