Download

1 / 49
490 likes | 721 Vues
Systems Biology II. Roadmap. Review from a long time ago when we last visited this topic. Review of some work we have done using a systems biology approach. Look at some research that benefited by adopting systems biology approaches . . “Inner life of a Cell” SIGGRAPH 2006 showcase winner.

E N D
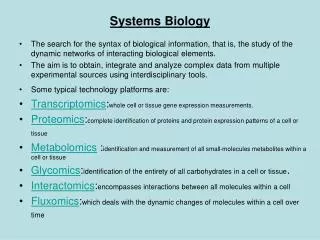
Roadmap • Review from a long time ago when we last visited this topic. • Review of some work we have done using a systems biology approach. • Look at some research that benefited by adopting systems biology approaches.
“Inner life of a Cell”SIGGRAPH 2006 showcase winner • Need to fight infection • WBC • Need to keep blood from leaking out
Two ways of looking a problem • Top down or bottom up • Either look at the whole organism and abstract large portions of it • Or try to understand each small piece and then after understanding every small piece assemble into the whole • Both are used, valid and complement each other
Blue line (pp) Yellow line (pd) Visualizing the data
Graph theory, networks • Two types of networks • Exponential and scale free • Most cellular networks are scale free • It makes the most sense to study the interactions of the central nodes not the outer nodes
Using network properties of a large complex data-set to evaluate the correlation of gene expression from a large microarray experiment
… Design of initial experiment SHR-SP SR/JR/HSD ♂ ♀ F1 rats 120 ♂F2 rats mRNA of whole eyes Gene expression Genotyping
Trans Summary of eQTL linkages Cis Transcript Location Marker Location
NPCE: Non-Positional Correlation of Expression Capture bio-relatedness Pair-wise correlation Macromolecular structures Metabolic pathways Disease Genes Devoid of marker information More information not dependant on marker density more noise
Strongly correlated genes r2 = 0.78 Expression BBS7 (log2) Expression BBS3 (log2)
Weak correlation r2 = 0.16 Expression ABCA4 (log2) Expression BBS4 (log2)
Looking at known pathways a simple cutoff value is not identifiable Partial correlation or multiple correlations More feasible but, still difficult May only work in a subset of pathways Most useful if you want to confirm membership to a known group? Difference between random and known pathways is small Another way? Pairwise correlations are not enough?
“Realworld” Networks • Tend to be highly clustered • Tend to have short path lengths • Many nodes with few interactions • Few nodes with many interactions
Useful tools • Cytoscape • Best for visualization • Limited (for us anyway) number of nodes • http://www.cytoscape.org/ • Networkx • Python module • Visualization and network discription -https://networkx.lanl.gov/
Using network properties • Can we use networks to identify “critical” genes? • Is it possible to determine a usable “cutoff” for correlations used to make the network • What correlation value will give a usable, relevant network? • Is this value similar to the p value determined from the distribution of correlations? • Is it possible to use network properties to identify a grouping of interacting genes (ex. pathway, subunits or other interactions)
Molecular function Most common - none glutamate-ammonia ligase activity GTPase activator activity carrier activity structural molecule activity DNA binding Biological process nitrogen fixation Transport vesicle fusion cell motility small GTPase mediated signal transduction Common ontologies
Validating a graph biological relevance • Need to use information to pick a correlation level(s) used to construct a graph. • After the graph is constructed • How well does it predict known bio-interactions
Validating against pathways • Kegg has a nice collection of pathway annotations (http://www.genome.jp/kegg/) • Also have a webservice interface • Allows programatic access to pathway annotations (http://www.genome.jp/kegg/soap/) • By species • By pathway • By pathway type • Some problems kegg id vs affy probe id • May be a many to many relationship
Rattus norvegicus (rat) metabolic pathways • Kegg has 110 metabolic pathways • Range in size from 3 members to 100’s of members • Examples: • Novobiocin biosynthesis • ATP synthesis • Fructose and mannose metabolism
Different values • Using a correlation of .9 • No coverage for either pathway or random set • Not enough connections, they may be significant, but only a small fraction are present • Lower correlations • Less clear • Much larger networks
Abca4 Bbs11 Bbs2 Bbs6 Bbs1 Bbs7 Bbs8 Bbs5 Bbs9 p < 0.001 Bbs3 p < 0.0002 Bbs4 0.45-0.54 0.55-0.64 0.65+
Conclusions • Network properties show promise as a way to look at this data • Pair-wise correlations and networks are unable to predict pathways or other interactions with certainty • But they can help • Using network tools and frameworks is a way to manage and simplify analysis
Acknowledgments Microarray collaborators Ed Stone Val Sheffield Jian Huang Kwang-youn Kim Ruth Swiderski Kevin Knudtson Rod Philp CBCB Todd Scheetz Tom Casavant Terry Braun Nathan Schulz
Example Studies • Physicochemical modeling of cell signaling pathways. B.B. Aldridge et al. Nature Cell Biology. 8(11) Nov 2006. 1195-1203. • Reverse engineering of regulatory networks in human B cells. K. Basso. Nature Genetics. 37(4) Apr 2005. 382-397. • Dynamic proteomics in individual human cells uncovers widespread cell-cycle dependence of nuclear proteins. A. Sigal. Nature Methods. 3(7) Jul 2006. 525-532. • Structural systems biology: modeling protein interactions. P. Aloy. Nature Reviews. Mar 2006. 188-198 .
Reverse engineering of regulatory networks in human B cells • Have lots of microarrays, how can you reconstruct the network of regulation. • Lower organisms, works • Higher, too much noise • ARACNe algorithm for the reconstruction of accurate cellular networks • Find correlated genes • Remove indirect correlations
Mutual Information • How much does value t1 tell you about value t2 • If MI = 0 there is no information if MI = 1 you have perfect information. • Similar to correlation coefficient but able to capture more complex interactions.
Find direct interactions • Use “data transmission theory” • Data processing inequality (DPI) • If (x,y) and (y,z) directly interact and (x,z) indirectly interact • Mutual information of x,z will be less than x,y or y,z • High MI values confound analysis • Three member loops are common, and difficult to parse.
Validation and conclusions • Validated 34 candidates by chip-chip • Make conclusions about hierarchical nature of the myc network • Know important members of the network for further study.
Dynamic proteomics in individual human cells uncovers widespread cell-cycle dependence of nuclear proteins • Measure temporal and spatial relations in dividing cells of 20 fluorescently labeled proteins.
Keys • New technique to introduce a fluorescent label that does not perturb the protein function (as much) • In-silico synchronization
Results of the paper: • Large number of proteins that probably are involved in cell cycle control • A general, scalable technique for studying location and interaction of proteins.