Download
1 / 65
650 likes | 758 Vues
Explore problems in credit pricing, bond duration, diversification, and risk management in corporate bond portfolios. Understand the relationships between credit spreads, returns, and portfolio diversification strategies.

E N D
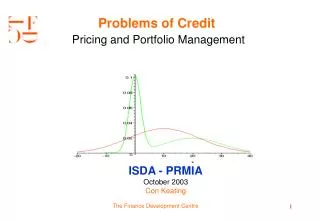
Problems of CreditPricing and Portfolio Management ISDA - PRMIA October 2003 Con Keating The Finance Development Centre
Spreads and Returns The relation is well known But this only applies to default free bonds And the duration of a corporate is difficult to estimate, the standard calculation does not apply. The Finance Development Centre
The Problem of Duration Consider two five year zero coupon bonds, a AAA and a BBB yielding respectively 6% and 10% while the equivalent government yields 5% The AAA has a modified duration of 5/1.06 = 4.71 years The BBB has a modified duration of 5/1.10 = 4.54 years The govt. has a modified duration of 5/1.05 = 4.76 years This suggests that lower credits are less risky and less volatile than governments of equivalent characteristics. The Finance Development Centre
Is this a practical problem? The relation between ex-ante spread and subsequent returns A sub-investment grade Index 1979 -2002 The Finance Development Centre
Some Statistics And correlations The Finance Development Centre
Transition Matrices One year above and Three year below The Finance Development Centre
Simulations A 150 bond equal weight AAA portfolioOne Year Returns -Credit Migration Alone The Set-Up The Finance Development Centre
The Results - AAA Distribution The Finance Development Centre
AA Returns Histograms The Finance Development Centre
A Returns Histograms The Finance Development Centre
Diversified AAA/AA/A/BBB Portfolio The skewness is not diversified away ! The Finance Development Centre
Diversification of Corporates Corporate spreads are largely a compensation for bearing credit risk, and one reason why they are so wide is that losses from default can easily differ substantially from expected losses. Moreover, such risk of unexpected loss is evidently difficult to diversify away. As corporate bond portfolios go, one with 1,000 names is unusually large, and yet our example shows it could still be poorly diversified in that unexpected losses remain significant. Reaching for yield: Selected issues for reserve managersRemolona and Schrijvers, BIS Quarterly Review, Sep 2003 The Finance Development Centre
Even small correlation can be harmful to your health A distribution of defaults with .02 correlation 98% independent 2% dependent The Finance Development Centre
Correlation and Dependence Higher moments are needed to capture dependence. Correlation tells one little about the shape of the joint distribution Copulae are little better. The presence of common factors tells much about dependence. Common Factors diversify slowly if at all The limits to (additive)diversification are well known But in the presence of common factors diversification may be slow and inefficient. The Finance Development Centre
Common Factors In the presence of common factors, tails can be arbitrarily thick. In the previous example, 100 defaults occur 5 standard deviations from the mean. This is the free lunch associated with CBO transactions Diversification score construction cards are flawed in this regard. The Finance Development Centre
One possible solution In hedge funds, we have always countered high correlation by short selling. Both are equally valid techniques for the reduction of variability. Long-Short neutralises all odd moments Long-Short tends to neutralise common factors The Sharpe ratio for a long only strategy is bounded above. The Sharpe ratio for Long-Short is unbounded The Finance Development Centre
Higher Moment Approaches A Hedge Fund trying to be Normal Skew 0.06 Excess Kurtosis 0.36 The Finance Development Centre
Log-Normal or Abnormal? One of these is lognormal. The other 2 have infinite skew and kurtosis The Finance Development Centre
Omega functions The left bias is evident, even though skew can’t be used to measure it. The Finance Development Centre
Omega HF and Normal Red is analytic normal of same mean and variance The (small) sample properties of the actual should make its Omega lie above on the downside and below on the upside. The Finance Development Centre
Risk Profile HF This Difference in Risk Profiles arises from Skew & Excess Kurtosis of just 0.06 and 0.36 The Finance Development Centre
The Omega function for a Distribution This process may be carried out for any series. The value of the Omega function at r is the ratio of probability weighted gains relative to r, to probability weighted losses relative to r. If F is the cumulative distribution then . The Finance Development Centre
Why is this important? The Omega function of a distribution is mathematically equivalent to the distribution itself. (Note for the quantitatively inclined. There is a closed form expression for F given Omega, just as there is for Omega given F.) None of the information is lost or left un-used. Sometimes mean and variance are enough… but sometimes the approximate picture they give hides the features of critical importance for terminal value. The Finance Development Centre
Graphically The area outlined in black is: The area outlined in red is: The Finance Development Centre
Omega for a normal distribution r . The slope at the mean is The Finance Development Centre
How can we reliably incorporate return levels and tail behaviour? Omega – A Sharper Ratio – does precisely this. • Assumes nothing about preference or utility • Works directly with the returns series • Is as statistically significant as the returns • Does not require estimation of moments • Captures all the risk-reward characteristics The Finance Development Centre
Basic Properties of W • It is equivalent to the distribution itself • It is a decreasing function of r • It takes the value 1 at the mean • It encodes variance, skew, kurtosis and all higher moments • Risk is encoded in the relative change in Omega produced by a small change in the level of returns. • The shape of Omega makes risk profiles apparent For two assets, the one with the higher Omega is, literally, A BETTER BET. The Finance Development Centre
Returns for 2 normally distributed assets A and B with the same means Asset A Asset B The Sharpe ratio says A is preferable to B. Omega says it depends on your loss threshold. Below the mean, A is preferable, above the mean, B is. The Finance Development Centre
Returns for 2 normally distributed assets A and B with the same means The superior portfolio is dependent upon the threshold level. If we measure performance based on a sample of mean 6.9, then we will see a preference reversal relative to 7.1. The Finance Development Centre
Omega Risk Profiles The risk is encoded in the way Omega responds to a small change in the level of returns: For normally distributed returns, at the mean this is simply determined by the standard deviation. The Finance Development Centre
Even for normally distributed returns, Omega has more information decreases as s decreases and also as we move away from the mean for fixed s The Finance Development Centre
Omega Risk Profiles for a distribution with negative skew and a normal with the same mean and variance show dramatically different features. Negative skew in green, Normal in Blue, mean is 8.5, Standard Deviation is 1.82 The Finance Development Centre
The Shape of OmegaOption Strategies Omegas for two US mortgage-backed strategies The Finance Development Centre
Risk Profiles – Option Strategies The Finance Development Centre
Simulations show the potential impact on terminal value. Losses were 250 times more likely with BH than with CL BH folded in September 2002 after a loss of 60% on a gamble for redemption. Loss ~ $500million. The SEC investigation continues… The Finance Development Centre
Returning to the earlier simulations The Finance Development Centre
AA- Omega(s) The Finance Development Centre
Rating Class - Omegas The Finance Development Centre
Portfolio & Rating Class - Omegas The Finance Development Centre
Covenants and Collateral Covenants in public debt are good for shareholders In a competitive investment market all of the gains associated with lower funding cost accrue to the company Covenants serve to discipline management Ratio test covenants of the income or asset coverage genre may increase the likelihood of default and distress Ratings triggers are really death spirals. The Finance Development Centre
Covenants and pricing Covenants restrict the range of possible state prices of corporate bond. Covenants increase the price of a bond Covenants, ceteris paribus, lower the mobility of the transition matrix. The Finance Development Centre
Security and Collateral To the extent they reduce the loss in default, also help to reduce the diversification problem The Finance Development Centre
Security and Collateral - Omegas This results in a higher mean return, and vastly better downside protection. The Finance Development Centre
Omega - Bond pricing The essence of pricing corporate bonds using Omega is to equate the Omegas over the range of support of the function. The Finance Development Centre
Dynamics of Corporate Bond Returns We need to examine two distinct elements The relation of returns to their prior returns - autocorrelation We might also consider correlation to treasuries. The Finance Development Centre
One Problem for the Statisticians Auto-correlation • Auto-correlation - the degree to which today’s return forecasts tomorrows. • Skill? • Or returns smoothing? The Finance Development Centre
Correcting for Auto-correlation • The differences are meaningful The Finance Development Centre
Adding a security to a portfolio The Finance Development Centre
Autocorrellogram - Portfolio Ex The Finance Development Centre
But this isn’t enough The Finance Development Centre