Download
1 / 14
140 likes | 289 Vues
13 th CBM Collaboration meeting March 10-13 2008, GSI, Darmstadt. Recent results of wavelet applications for handling invariant mass spectra. Gennady Ososkov LIT JINR, Dubna Piotr Koczon GSI, Darmstadt Semeon Lebedev, LIT JINR, GSI, Darmstadt. Math background.

E N D
13th CBM Collaboration meeting March 10-13 2008, GSI, Darmstadt Recent resultsof wavelet applications for handling invariant mass spectra Gennady Ososkov LIT JINR, Dubna Piotr Koczon GSI, Darmstadt Semeon Lebedev, LIT JINR,GSI, Darmstadt
Math background Wavelet transfom is a convolution of invariant mass spectrum f(x) and a special biparametric wavelet function . Most famous example of wavelet is “Mexican hat” where ψ(x)= is in fact, the 2d derivative n=2 of a gaussian with σ=1, x0=0, A=1 Wavelet-analysis is used, in common, as a mean for smoothing signals and filtering them from noise position noisy signal transformed into a surface
Specifics to keep in mind 1. remarkable robustness to noise and 2. Gibbs effect on edges variiation of granulation bin missing important! 3. Continuos wavelets are non-orthogonal and therefore are used quite rare. 4. Wavelet G2 transforms a gaussian g(x;A,xo,σ) into wavelet of the same corresponding wavelets order, but with parameters of that gaussian: It is true for any order nand leads to the idea of looking for the peak parameters directly in Gn domain without its back-transformation
Recall to wavelet introduction Applicatios for extracting special features of mixed andcontaminated signal An example of the signal with a localized high frequency part and considerable contamination then wavelet filtering is applied G2wavelet spectrum of this signal Filtering works in the wavelet domain by thresholding of scales, to be eliminated or extracted, and then by making theinverse transform Filtering results. Noise is removed and high frequency part perfectly localized
How to estimate peak parameters in G2 wavelet domain Let us have a noisy inv. mass spectrum 1. transform it by G2 into wavelet domain 2. look for the wavelet surface maximum bmax ,amax. From the formula for WG2(a,b;x0,σ)g one can derive analytical expressions for its maximum x0 and . which should correspond to the found bmax ,amax . Thus we can use coordinates of the maximum as estimations of wanted peak parameters peak has bell-shape form amax From them we can obtain halfwidth of the real peak , its amplitude and even its integral bmax
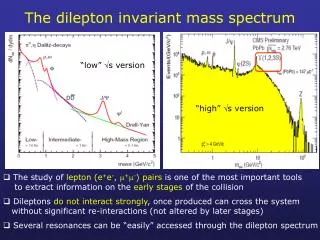
Brief history of handling invariant mass spectra 1. Low-mass dileptons (muon channel) - ω–wavelet spectrum ω.Gauss fit of reco signal M=0.7785 σ=0.0125 A=1.8166 Ig=0.0569 ω.Wavelets M=0.7700 σ=0.0143 A=1.8430 Iw=0.0598 ω. Thanks to Anna Kiseleva ω-meson φ-meson Evenφ- and mesons have been visible in the wavelet space, so we could extract their parameters.
2. Wavelet application for resonance structure study thanks to V.Toneev d c a Invariant mass distributions of γγ pairswithout (upper panel) and with (bottom panel) the backgroundsubtraction.
2. Wavelet application for resonance structure study - II The idea was to cofirm the existance of resonance cby some independent method Gaussian wavelets of the 8-th order were used The invariant mass distribution of γγ pairs for dC interactions The most important scale region above noise level shown in logarithmic scale
New example Wavelets G4 are used The first set of FOPI data was provided by N.Herrmann (rather poor statistics)
New example - II Wavelets G4 are used. The formula for σ obtaining is σ = amax/3 much higher statistics gives very jaggy spectrum, although wavelets give visible peaks with σ1 =σ3 = 0.011, σ2 = 0.023 original spectrum 2 3 1 noise level σ = 0.009
New example - III Simulated background gives wavelet surface without significant peaks event mixing background
New example - IV our spectrum after background subtraction looks disappointing, but on the wavelet surface one can clearly see some significant peaks spectrum after background subtraction low frequency pedestal 2 1 3 σ1 = 0.011, σ2 = 0.023, σ3 =0.01
Summary and outlook • Wavelet approach looks quite applicable for handling invariant mass spectra with small S/B ratio • Algorithms and programs have been developed for estimating resonance peak parameters on the basis of gaussian continuous wavelets • It allows to avoid cumbersome background calculating • Algorithm of peak detecting should be furnished for automatic peak search and their parameters estimation. Its confidence is to be expressed more clear • New interesting examples are quite welcome