Adapting Idaho Agriculture to Climate Shifts: A Hydro-Economic Model Study
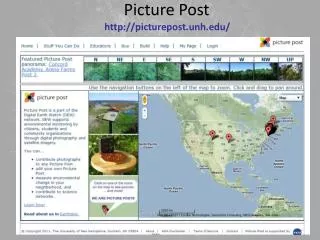
Investigating how Idaho farmers respond to changing precipitation patterns using an integrated hydro-economic model focusing on crops like forage hay, wheat, barley, and sugar beets in the Western Snake River Basin.

Adapting Idaho Agriculture to Climate Shifts: A Hydro-Economic Model Study
E N D
Presentation Transcript
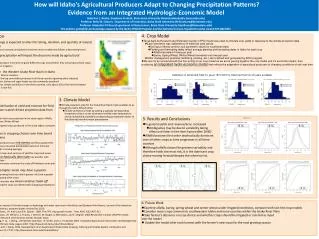
How will Idaho's Agricultural Producers Adapt to Changing Precipitation Patterns? Evidence from an Integrated Hydrologic-Economic ModelGretchen L. Beebe, Graduate Student, Boise State University (GretchenBeebe@u.boisestate.edu) Professor Kelly M. Coburn, Department of Economics, Boise State University (kellycoburn@boisestate.edu)Professor Alejandro N.Flores,Department of Geosciences, Boise State University (lejoflores@boisestate.edu)The authors gratefully acknowledge support by the Idaho EPSCoR Program and the National Science Foundation under award EPS-0814387. LOGO 1. Introduction • Climate change is expected to alter the timing, duration, and quantity of natural precipitation • As temperatures increase, precipitation becomes more variable and follows a decreasing trend • Changes in precipitation will impact the decisions made by agricultural producers • We examine producer incentives to grow different crops and whether they will produce those crops with or without irrigation • We focus on the Western Snake River Basin in Idaho • Ada, Canyon, Elmore Counties • Forage hay is the top commodity produced in all three counties (growing dairy industry) • Wheat for grain, barley and sugar-beets are also commonly produced • Due to the drier climate conditions in the three counties, only about 10% of the land harvested for each crop is rain-fed • 4. Crop Model • Texas AgriLife Research and Extension Center’s EPIC model was used to simulate crop yields in response to the climate projection data • Each simulation was calibrated to fit historical yield values • Soil input reflects common soil parameter values for southwest Idaho • Planting and harvesting dates reflect average planting and harvesting dates in Idaho for each crop • Alfalfa harvested 4 times per year • Barley, Spring Wheat, Winter Wheat harvested one time per year • Other management practices (fertilizing, plowing, etc.) set to default and generated by EPIC program • We are not as concerned with the fine-tuning of our crop model as we are in piecing together the crop model and it’s economic impact, thus producing an integrated hydro-economic modelthat reflects the adaptation of agricultural producers to changing conditions of risk over time Calibration of Generated Yield (for years 1973-2007) to Observed Yield (for all years available) 2.Objective • Estimate the distribution of yield and revenue for field crops using down-scaled climate projection data from 2010-2090 Step 1: Examine rain-fed crops produced in the study region: Alfalfa, Barley, Spring Wheat, Winter Wheat Step 2: Examine irrigated crops produced in the study region, compare with rain-fed • Evaluate changes in cropping choices over time based on economic criteria • We assume the producers arerisk-averse and they update their expectations about a seasonal precipitation based on historical observation (with a moving average) • We compare the mean and variance of yield for crops and assess which crop(s) stochastically dominate one another with changing conditions • Stochastic dominance examines the trade-off between mean and variance • A crop with a higher mean may have a greater variance, so growing that crop entails greater risk (and a greater reward) than growing other crops • We estimate whether that mean-variance trade-off changes among the crops considered with changing precipitation 3. Climate Model • Climate projection data for the Snake River Basin made available to us through the Idaho EPScoR office • Climate predictions made by adding a spatially corresponding temperature factor to the observed monthly mean temperature and by multiplying a spatially corresponding precipitation factor to the observed monthly mean precipitation Figure 6. Figure 7. Figure 8. PICTURE PLACEHOLDER Figure 5. PICTURE PLACEHOLDER PICTURE PLACEHOLDER PICTURE PLACEHOLDER PICTURE PLACEHOLDER 5. Results and Conclusions 5. Results and Conclusions • In general yields and revenue/acre increased • Ambiguities may be due to variability taking effect until later in the time frame (after 2040) • Alfalfa becomes first-order stochastically dominant over all other crops as time progresses in all three counties • Although alfalfa shows the greatest variability and therefore holds the most risk, it is the dominant crop choice moving forward despite the inherent risk. Figure 9-11. Properties of Projected Climate Data for Ada County Figure 2. Figure 2. PICTURE PLACEHOLtttDER PICTURE PLACEHOLtttDER PICTURE PLACEHOLtttDER PICTURE PLACEHOLtttDER PICTURE PLACEHOLDER Figure 3. Figure 4. References • Jin, X., and V. Sridhar, Impact of climate change on hydrology and water resources in the Boise and Spokane River Basins, Journal of the American Water Resources Association, accepted under revision Dec 2010. • Williams, J.R., C.A. Jones, J.R. Kiniry and D.A. Spanel. 1989. The EPIC crop growth model. Trans ASAE 32(2):497-511 • Gerik, T.J., W.L. Harman, J.R. Williams, L. Francis, J. Greiner, M. Magre, A. Meinardus, and E. Steglich. 2006 Researcher's Guide: WinEPIC model, version 3.0. Blackland Research and Extension Center, Temple, Texas. • Wilson, L. T., Y. Yang, P. Lu, J. Wang, J.W. Nielsen-Gammon, N. Smith, and C.J. Fernandez.2007. Integrated Agricultural Information and Management System(iAIMS):World Climatic Data. August 2007. http://beaumont.tamu/edu/ClimaticData/ • Yang, Y., L.T. Wilson, and J. Wang. 2010. Development of an Automated Climatic Data Scraping, Filtering and Display System. Computers and Electronics in Agriculture 71:77-87. http://beaumont.tamu.edu/ClimaticData/ • 6. Future Work • Examine alfalfa, barley, spring wheat and winter wheat under irrigated conditions, compare with rain-fed crop models • Consider more crops common to southwestern Idaho and more counties within the Snake River Plain • Take farmer’s decisions on crop choice and whether crops should be irrigated or rain-fed as input • into the model • Update the model after each harvest with the farmer’s new input for the next growing season PICTURE PLACEHOLDER