Download
1 / 1
10 likes | 148 Vues
Congresso del Dipartimento di Fisica Highlights in Physics 2005 11–14 October 2005, Dipartimento di Fisica, Universit à di Milano The Planck satellite: getting ready for scientific data analysis

E N D
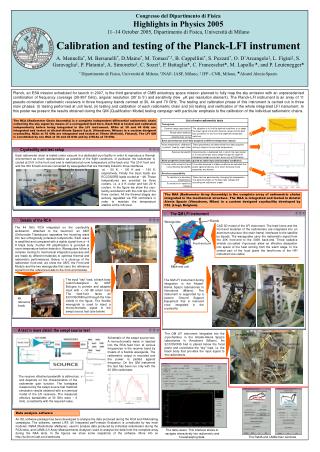
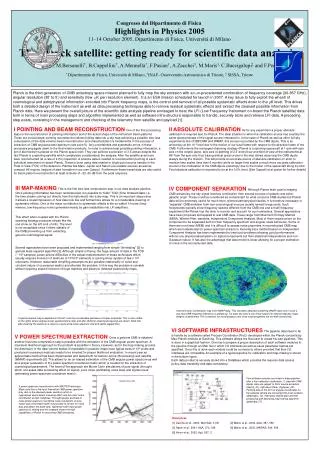
Congresso del Dipartimento di Fisica Highlights in Physics 2005 11–14 October 2005, Dipartimento di Fisica, Università di Milano The Planck satellite: getting ready for scientific data analysis D.Maino*, M.Bersanelli*, B.Cappellini*, A.Mennella*, F.Pasian†, A.Zacchei†, M.Maris†, C.Baccigalupi‡ and F.Perrotta‡ * Dipartimento di Fisica, Università di Milano, †INAF- Osservatorio Astronomico di Trieste, ‡ SISSA, Trieste Planck is the third generation of CMB anisotropy space mission planned to fully map the sky emission with an un-precedented combination of frequency coverage (30-857 GHz), angular resolution (30’ to 5’) and sensitivity (few K per resolution element). It is an ESA mission scheduled for launch in 2007. A key issue to fully exploit the whealt of cosmological and astrophysical information encoded into Planck frequency maps, is the control and removal of all possible systematic effects down to the K level. This drives both a detailed design of the instrument as well as data processing techniques able to remove residual systematic effects and extract the cleanest possible information from Planck data. Here we present the overall picture of the scientific data analysis pipeline envisaged to treat the LFI (Low Frequency Instrument on-board the Planck satellite) data both in terms of main processing steps and algorithm implemented as well as software infra-structure responsible to handle, securely store and retrieve LFI data. A preceding step exists, consisting in the management and checking of the telemetry from satellite and payload [1]. I POINTING AND BEAM RECONSTRUCTIONOne of the first processing steps is the reconstruction of pointing information and of the actual shape of the instrument beam patterns. These are crucial steps: pointing reconstruction allows folding data into a sky map achieving a possible loss-less compression of the data volume; beam reconstruction and characterization is fundamental in the process of extraction of CMB angular power spectrum (see point V). Any uncertainties and systematic errors in these processes propagate down to the final mission products. In order to achieve best possible pointing information, a set of star-tracker is placed on the Planck space-craft. They can achieve a precision of 3.5 arcsec despite the fact Planck is a spinning satellite which complicates considerabely the analysis. After the satellite axes have been reconstructed (at a rate of 4 Hz) inspection of science data is needed to reconstruction pointing of each individual instrument on-board Planck. These is done using data relative to bright point source transits in the Field of View (FOV) of the detectors. Plantes like Mars, Jupiter and Saturn are suitable sources as well as compact HII regions (regions of start formation in our own Galaxy). Furthermore these transit data are also useful for beam pattern reconstruction at least at levels of –20,-30 dB from the peak response. II ABSOLUTE CALIBRATIONAs for any experiment a proper absolute calibration is required also for Planck. The ideal situation is when the calibration source has exactely the same spectral shape of the signal we are interested in. In the case of Planck as well as other full-sky experiments like COBE-DMR and WMAP, this source is provided by the CMB dipole. This is an anisotropy at the 10-3 level due to the motion of our local frame with respect to the absolute frame of the CMB. Furthermore the envisaged observing strategy (Planck is a spinning spacecraft at 1 rpm with spin axis on the ecliptic plane, spix-axis re-pointing of 2.5’ every hour and field of view of the instruments at 850 from the spin-axis thus tracing almost great circles in the sky) allows observing the CMB dipole always during the mission. This will provide an accurate source of absolute calibration on short to medium time scales (less than 6 months) while on larger time scales a much more accurate calibration source is the modulation of the CMB dipole anisotropy due to the motion of the spacecraft along its orbit. Final absolute calibration is expected to be at the 0.5% level. [See Cappelli et al poster for further details] III MAP-MAKINGThis is the first loss-less compression step in our data analysis pipeline. Once pointing information has been reconstructed, it is possible to “folde” TOD (Time Ordered Data, i.e. the time stream coming out directly from the instrument) into a sky map. This is an important steps since it allows a visual impression of how data look like and furthermore allows for a considerable cleaning of systematic effects. One of the major contribution to systematic effects is the so-called 1/f noise (long-memory, low-frequency noise) generated mainly by gain instabilities into LFI amplifiers. IV COMPONENT SEPARATION Although Planck main goal is imaging CMB anisotropy, the sky signal receives contribution from several sources of galactic and extra-galactic origin. These could be considered as contaminant for what concerns CMB studies but Planck data will be extremely useful for much more oriented astrophysical studies. It is therefore necessary to “separate” CMB emission from non-cosmological sources usually named foregrounds. Such foregrounds typically show frequency spectra different from the CMB one and a multi-frequency experiment like Planck has the lever to monitor and account for such emissions. Several approaches have been proposed and applied to real CMB data. These range from Maximum Entropy Method (MEM), Wiener Filter, wavelets, Independent Component Analysis. Most of them require priors on the component to be separated both for their frequency spectrum and angular scale behaviour. Some of them are non-linear (MEM) and it is diffucult to assess noise properties in reconstructed CMB map which are fundamental for power spectrum extraction. Recently [4] a method based on Independent Component Analysis has been implemented to treat such problems showing good performances without any physical assumptions on signal components but their statistical independence and non-Gaussian nature. It has also the advantage that data model is linear allowing for a proper estimation of noise in thereconstructed data. This effect when coupled with the Planck scanning strategy produces stripes like the one show on the left (unit of mK). The level is not acceptable since it alters statistic of the CMB preventing us from extracting genuine cosmological signal. Several approaches have been proposed and implemented ranging from simple “de-striping” [2] to general least-squared algorithm [3]. Although simple in theory, the huge amount of data in the TOD (~ 109 samples) poses severe difficulties in the actual implementation of these techniques which usually requires inversion of matrices of 109x109 elements or solving linear system of few x 105 unknowns. However reasonable simplifing assumptions are possible (stationatiry of noise and circulant nature of covariance matrix) and alleviate the problem. In this way the problem is solvable without requiring explicit inversion of huge matrices and allows to obtained cleaned sky maps. Internal Linear Combination map from WMAP data. This has been obtained combining WMAP data only in such a way that CMB frequency behaivour is picked-up. For each sky pixel a non-linear search for optimal frequecy maps weights is performed. This is explicity for visual purpose only since noise properties are not well constrained. A typical cleaned map is depicted on the left: note the considerable decrease of stripes amplitude. This is also visible on the rights where angular power spectra before (top) and after (bottom) cleaning processing are shown. Note that after cleaning the spectrum is close to a pure white-noise spectrum (red and yellow jagged line). VI SOFTWARE INFRASTRUCTURESThe pipeline described to far is handle by a software called Process Coordinator (ProC) developed within the Planck consortia by Max-Planck Institute at Garching. This software allows the final user to create his own pipelines. This is done in a graphical fashion. One has to prepare a proper description of each software modules in the pipeline through an XML file in which I/O interfaces as well as usual parameter names are specified. Once this is done each module could be connects to others provided that their I/O interfaces are compatible. An example of a typical pipeline for calibration and map-making is shown in the bottom figure. V POWER SPECTRUM EXTRACTION Once a geniune CMB is obtained another loss-less compression step is possible with the extraction of the CMB angular power spectrum. A maximum likelihood approach to the problem is possible in theory. However, as for the map-making process, the dimension of the data volume makes it impossible in practice: maps have typical sizes of 106 pixels and pixel-pixel covariance matrices needs to be inverted for proper likelihood evaluation. In recent year an approximate method has been implemented and tested both for balloon-borne (Boomerang) and satellite (WMAP) experiments [5]. This allows for an un-biased estimation of the CMB angular power spectrum as well as a proper evaluation of the power spectrum covariance matrix which is needed for the extraction of cosmological parameters. The heart of the approach are Monte Carlo simulations of pure signal (throught which one asses data processing effect on signal), pure noise (estimating noise bias) and signal+noise (estimating power spectrum covariance matrix). Each data product is securely stored into a DataBase which provides the requires data access policy, data tracebility and data consistency. Five software modules are linked in these pipeline: after a first calibration (calibration_7) step with CMB dipole, data are subject to Point source extraction (Sextra_31), high-pass filterer (highpass_25). Pointing data in the form of angular coordinates on the celestial sphere are converted into pixel numbers (detpnt2pix_10). High-pass filtered data are then processing with destriping map-making algorithm (gdestripe_27). A power spectrum reconstruction with MASTER techinque. Black solid line is the input theoretical CMB power spectrum, gray dots is the obseved power spectrum which is suppressed due to beam smearing effect and has clear noise contribution at high multipoles. Throught proper estimate of noise power spectrum (via Monte Carlo simulations of pure noise) and of the beam width it is possible to correct for noise bias and obtain the black dots. Agreement with input power spectrum is striking and this example shows the high capabilities of Planck in recovering CMB anisotrpies. References [1] Zacchei et al., 2003, MemSait, 3,331 [2] Maino et al., 2002, A&A, 387, 356 [3] Natoli et al., 2001, A&A, 372, 346 [4] Maino et al., 2003, MNRAS, 344, 544 [5] Hivon et al., 2002, ApJ, 567, 2