Download
1 / 1
10 likes | 127 Vues
BIOGENIC VOC EMISSIONS ESTIMATION BY USING THE GLOBAL LAND COVER CHARACTERISTICS DATABASE Ozan Devrim Yay Anadolu University, Dept. Of Environmental Engineering, Turkey.

E N D
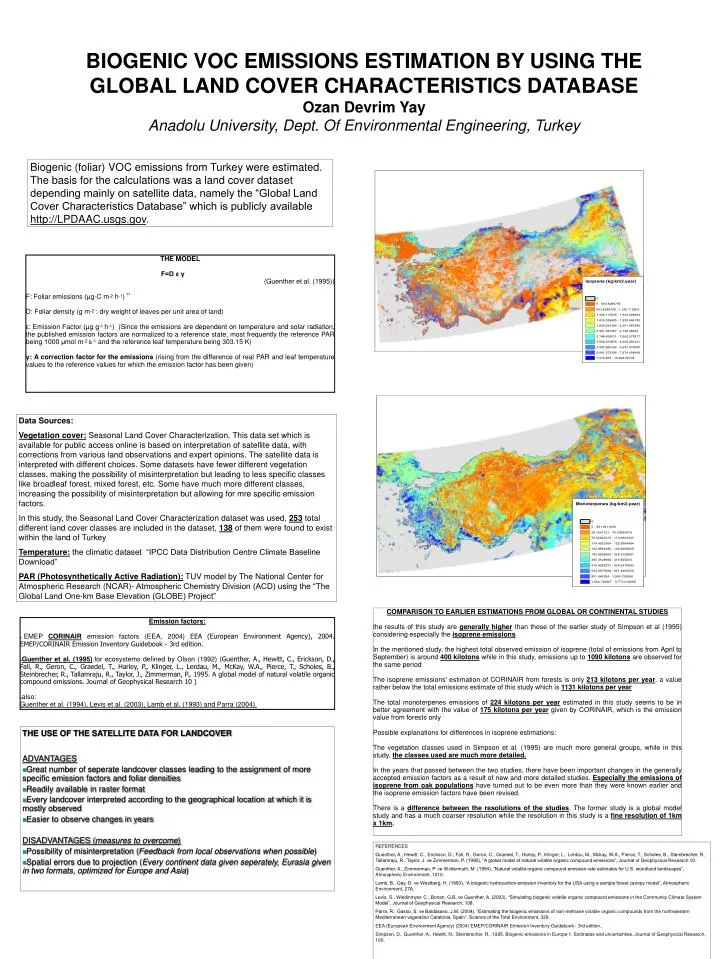
BIOGENIC VOC EMISSIONS ESTIMATION BY USING THE GLOBAL LAND COVER CHARACTERISTICS DATABASEOzan Devrim YayAnadolu University, Dept. Of Environmental Engineering, Turkey Biogenic (foliar) VOC emissions from Turkey were estimated. The basis for the calculations was a land cover dataset depending mainly on satellite data, namely the “Global Land Cover Characteristics Database” which is publicly available http://LPDAAC.usgs.gov. THE MODEL F=D ε γ (Guenther et al. (1995)) F: Foliar emissions (μg-C m-2 h-1) ** D: Foliar density (g m-2 : dry weight of leaves per unit area of land) ε: Emission Factor (μg g-1 h-1) (Since the emissions are dependent on temperature and solar radiation, the published emission factors are normalized to a reference state, most frequently the reference PAR being 1000 μmol m-2 s-1 and the reference leaf temperature being 303.15 K) γ: A correction factor for the emissions (rising from the difference of real PAR and leaf temperature values to the reference values for which the emission factor has been given) Data Sources: Vegetation cover:Seasonal Land Cover Characterization. This data set which is available for public access online is based on interpretation of satellite data, with corrections from various land observations and expert opinions. The satellite data is interpreted with different choices. Some datasets have fewer different vegetation classes, making the possibility of misinterpretation but leading to less specific classes like broadleaf forest, mixed forest, etc. Some have much more different classes, increasing the possibility of misinterpretation but allowing for mre specific emission factors. In this study, the Seasonal Land Cover Characterization dataset was used. 253 total different land cover classes are included in the dataset, 138 of them were found to exist within the land of Turkey Temperature:the climatic dataset “IPCC Data Distribution Centre Climate Baseline Download” PAR (Photosynthetically Active Radiation): TUV model by The National Center for Atmospheric Research (NCAR)- Atmospheric Chemistry Division (ACD) using the “The Global Land One-km Base Elevation (GLOBE) Project” COMPARISON TO EARLIER ESTIMATIONS FROM GLOBAL OR CONTINENTAL STUDIES the results of this study are generally higher than those of the earlier study of Simpson et al (1995) considering especially the isoprene emissions In the mentioned study, the highest total observed emission of isoprene (total of emissions from April to September) is around 400 kilotons while in this study, emissions up to 1090 kilotons are observed for the same period The isoprene emissions' estimation of CORINAIR from forests is only 213 kilotons per year, a value rather below the total emissions estimate of this study which is 1131 kilotons per year The total monoterpenes emissions of 224 kilotons per year estimated in this study seems to be in better agreement with the value of 175 kilotons per year given by CORINAIR, which is the emission value from forests only Possible explanations for differences in isoprene estimations: The vegetation classes used in Simpson et al. (1995) are much more general groups, while in this study, the classes used are much more detailed. In the years that passed between the two studies, there have been important changes in the generally accepted emission factors as a result of new and more detailed studies. Especially the emissions of isoprene from oak populations have turned out to be even more than they were known earlier and the isoprene emission factors have been revised. There is a difference between the resolutions of the studies. The former study is a global model study and has a much coarser resolution while the resolution in this study is afine resolution of 1km x 1km. Emission factors: • EMEP CORINAIR emission factors (EEA, 2004) EEA (European Environment Agency), 2004. EMEP/CORINAIR Emission Inventory Guidebook - 3rd edition. • Guenther etal. (1995).for ecosystems defined by Olson (1992) (Guenther, A., Hewitt, C., Erickson, D., Fall, R., Geron, C., Graedel, T., Harley, P., Klinger, L., Lerdau, M., McKay, W.A., Pierce, T., Scholes, B., Steinbrecher, R., Tallamraju, R., Taylor, J., Zimmerman, P., 1995. A global model of natural volatile organic compound emissions. Journal of Geophysical Research 10 ) • also: Guenther et al. (1994), Levis et al. (2003), Lamb et al. (1993) and Parra (2004). • THE USE OF THE SATELLITE DATA FOR LANDCOVER ADVANTAGES • Great number of seperate landcover classes leading to the assignment of more specific emission factors and foliar densities • Readily available in raster format • Every landcover interpreted according to the geographical location at which it is mostly observed • Easier to observe changes in years DISADVANTAGES (measures to overcome) • Possibility of misinterpretation (Feedback from local observations when possible) • Spatial errors due to projection (Every continent data given seperately, Eurasia given in two formats, optimized for Europe and Asia) REFERENCES Guenther, A., Hewitt, C., Erickson, D., Fall, R., Geron, C., Graedel, T., Harley, P., Klinger, L., Lerdau, M., Mckay, W.A., Pierce, T., Scholes, B., Steınbrecher, R., Tallamraju, R., Taylor, J. ve Zımmerman, P. (1995), “A global model of natural volatile organic compound emissions”, Journal of Geophysical Research 10. Guenther, A., Zımmerman, P. ve Wıldermuth, M. (1994), “Natural volatile organic compound emission rate estimates for U.S. woodland landscapes”, Atmospheric Environment, 1210. Lamb, B., Gay, D. ve Westberg, H. (1993), “A biogenic hydrocarbon emission inventory for the USA using a sample forest canopy model”, Atmospheric Environment, 27A. Levis, S., Wiedinmyer, C., Bonan, G.B. ve Guenther, A. (2003), “Simulating biogenic volatile organic compound emissions in the Community Climate System Model”, Journal of Geophysical Research, 108. Parra, R., Gasso, S. ve Baldasano, J.M. (2004), “Estimating the biogenic emissions of non-methane volatile organic compounds from the northwestern Mediterranean vegetation Catalonia, Spain”, Science of the Total Environment, 329. EEA (European Environment Agency) (2004) EMEP/CORINAIR Emission Inventory Guidebook - 3rd edition,. Simpson, D., Guenther, A., Hewitt, N., Steinbrecher, R., 1995. Biogenic emissions in Europe 1. Estimates and uncertainties. Journal of Geophysical Research, 100.