Download
1 / 64
640 likes | 790 Vues
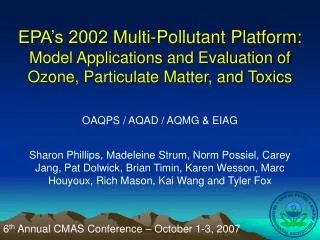
OAQPS Modeling, monitoring, emissions (AQAD) Updates. Rich Scheffe US EPA – Office of Air Quality Planning and Standards. Example Benefits to EPA headquarters and the national air quality assessment community. Treatment of fires in NEI and modeling inventories VIEWS data analysis system

E N D
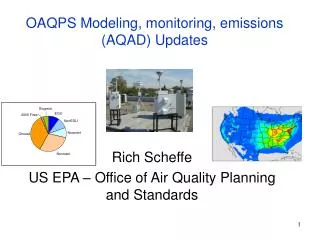
OAQPS Modeling, monitoring, emissions (AQAD) Updates Rich Scheffe US EPA – Office of Air Quality Planning and Standards
Example Benefits to EPA headquarters and the national air quality assessment community • Treatment of fires in NEI and modeling inventories • VIEWS data analysis system “the complex terrain, variety of emissions, meteorology and spatial vastness suggests that Western U.S. assessment practice will lead efforts in comprehensive air quality characterization out of necessity”
Thanks • Kirk Baker • Tyler Fox • Lew Weinstock • Pat Dolwick • Joann Rice • Time Hanley • Robin Segall • Mark Houyoux • Ellen Baldridge • David Mintz • Jim Szykman (ORD) • Vasu Kilaru (ORD) • Jack Fishman (NASA)
Topics • Emissions and Modeling • National Monitoring Programs • NAAQS driven • NO2 and ozone primary • NOx/SOx secondary • Ozone secondary • Non regulatory • NCORE, CASTNET, CSN, satellites • Blending data and Data integration/IT systems • National assessment tools and Western U.S. air quality- reinforcing the importance of regional partnerships to address regional issues
Integration across pollutants, climate and media: tradeoffs and optimum strategies? Primary Sources HAP metals VOC (HAPs) CO NO SVOC SO2 Hg O3 O3 OH OH, O3 RO2 HO2 hν OH hν NO2 OH Hgo,Hg2 OH NH3 HNO3 H2SO4 gases particles Organic PM Nitrate PM Sulfate PM Chemical Deposition Climate forcing Climate forcing Climate forcing Climate forcing Climate forcing
8-hr ozone PM2.5 (annual driver) Regional Rules New PM Standards Daily/annual drivers Biogenics Regional science Initial CAA 1970 2000 2010 1990 Local/urban Regional Hemispheric Evolutional change in National Air Pollution Management 2050 Climate-AQ Hemispherical Transport
Emissions Measurements, National Emissions Inventory (NEI) and Modeled Emissions • Note: new Emissions Inventory System (EIS) to house 2008 base NEI • Early 2011 availability • 2001-2006 processed emissions for base year CMAQ simulations that drove CDC PHASE • MP versions of 2002 and 2005 NEI and processed 12 km model fields (West and East) • Note: EPA uses multi-year averaged fire emissions to carry to future projections
Focus on improving Western U.S. oils and gas operations Retroreflector Open Path FTIR Nonlocalized Emission Source Optical Remote Sensing (ORS)Path-Averaged Concentration Data • EPA Other Test Method 10 (OTM 10) – addressing fugitive VOCs • Open Path FTIR • Broadband instrument (Multiple Compounds at once) • Monostatic (Source and Detector in one instrument) • Mounted on Orbital Scanner • Summa Canisters • TO – 14A – GC/FID • TO – 15 – GC/MS • Met Station • FLIR Camera
NOx NorthEast SouthEast SouthWest Western PM2.5 MidWest West NH3 Eastern PM2.5 VOC Annual Average regional distribution of NOx and NH3 Emissions (courtesy, M. Houyoux) NOx VOC NH3
Air Quality Modeling • Nationally • Variety of NAAQS REA and RIA, mobile source and point source regulatory applications (2005 base): lifeblood of OAQPS • Constant evaluation (CMAQ) as new processes/versions are developed by ORD • Emerging developments • Treating fines scales to address MP issues and support exposure modeling • Instrumented modeling (SA) to more efficiently address attribution (primarily CAMX) • Climate-AQ interactions • Searching for optimized AQ-climate benefits • Emphasis on short-lived species (O3, BC)
PM2.5 Sulfate Ion Western U.S. Photochemical Modeling Background(K. Baker) • State of the science 3 dimensional photochemical grid models simulate the formation and transport of many secondarily formed pollutants and such as ozone and particulate matter • Currently using both CMAQ v4.7 and CAMx v5.01 • Most recent modeling platform for western United States applications based on 2005 U.S. emissions; 2006 Canada and 1999 Mexico • The 2005 emissions platform has been augmented with the WRAP Phase II oil and gas emission inventory • Model performance for PM2.5 not ideal; sulfate ion estimates compare well to STN and IMPROVE but most other species do not • Peak ozone tends to be underestimated in many urban areas; not currently capturing high winter ozone episodes PM2.5 Total Mass
Photochemical model source apportionment is a useful tool to assess interstate pollution transport Ozone and PM2.5 source apportionment used to track all anthropogenic emissions from western States to key receptor locations The sources selected for tracking with ozone source apportionment include all anthropogenic emissions from 17 selected States, Canada, Mexico, and boundary conditions Texas, Oklahoma, and Kansas are partial States due to domain configuration Annual 12 km source apportionment simulations for 2005 and 2006 tracking State specific anthropogenic emissions to ozone and PM2.5 estimated at key receptor locations Issues with PM2.5 model performance may delay PM2.5 transport assessment in the western U.S. Need to continue to work with WRAP and the western States to improve our western US modeling platform Western Transport Assessment (courtesy, K. Baker)
Modeling Issues (T. Fox) • tighter O3 stds in particular will place more of an emphasis on improving model performance in the non-California west--wintertime ozone formation issues, transport, visibility. • Also will need to work closer with States that have not had to conduct such photochemical modeling for SIP demos for O3 or PM2.5 • We provide SIP modeling guidance and App W but what can we do to better inform and communicate to foster collaborations here? 2) Multiple players so how best to communicate and coordinate? 3) oil and gas development is key emissions source that we need to improve coordination on
Updating the Ozone Monitoring Network (L. Weinstock) • Intent noted in 2008 NAAQS final rule; monitoring proposal published July 16, 2009, final rule expected in 2010 • Key provisions: • Additional monitors in smaller urban areas where not already operating • New non-urban monitors (3 per state) to characterize sensitive ecosystems and/or to provide coverage in less populated areas where elevated levels are occurring or likely • Lengthened ozone monitoring seasons, where necessary, to ensure network operation when ambient levels approach NAAQS • Proposed new monitors be deployed by January 1, 2012 • Proposed ozone monitoring season changes effective on the first day of ozone monitoring in 2011 Look for a final ozone monitoring rule sometime between April and August of 2010
2009 National Ambient Air Monitoring Conference, Nashville, TN Revising the Ozone Monitoring Seasons
2009 National Ambient Air Monitoring Conference, Nashville, TN Revising the Ozone Monitoring Seasons
Current NO2 (?) Monitoring Network • The current network was implemented to support an annual standard • The existing sites are satisfying multiple objectives including: • NAAQS compliance • assessment of ozone formation and transport • health study support • Prevention of Significant Deterioration (PSD) The current NO2 network has approximately 400 sites, mostly representing area wide scales (neighborhood or larger scales)
Near-road NO2 Site Selection • Rank all road segments within a CBSA by Annual Average Daily Traffic (AADT) and then identifying a location or locations adjacent to those highest road segments where maximum hourly NO2 concentrations are expected to be highest • Additional factors to consider: proximity to interchanges, fleet mix (diesel vs. light-duty), rapidly accelerating traffic, grade-climbing traffic, local terrain and meteorological effects • Monitor probes must be no greater than 50 meters away, horizontally, from the outside nearest edge of the traffic lanes of the target road segment • Located within 2 to 7 meters above the ground; may be placed on the interior side of any noise barriers (not ideal, however) Beckerman et.al., 2008
Alternative approach – area wide (only) sites Alternative NO2 Network Design Area-wide sites only Note: Alaska would have 1 area-wide site in Anchorage and Hawaii would have 1 area-wide site in Honolulu. San Juan, PR would have 2 area-wide sites.
Role of National Assessment Tools in support of Western U.S. Air Quality • Historical emphasis on Eastern US applications • Original RADM NAPAP modeling, ROM • The West is challenging relative to softer gradations in Eastern U.S. topography • Further confounded by: • Challenging emissions characterizations, e.g., • dominant role of fires • New dispersed oil/gas operations • Meteorology • Precursor Concentration enhancing (mtn-valley inversions) • Exacerbated photochemical stimulation (bright surfaces/snow) • Intercontinental transport • Western Modeling Center? • Monitoring network design tethered to population surrogate approaches • Natural conflict with Western heterogeneity
Rethinking Nitrogen/ozone monitoring in rural/regional scales • Nitrogen is universal across environmental issues/media, atmospheric chemistry and physics, and national control scenarios --echoing Paul T. • Population weighted approach inadequate to characterize regional scale air quality – exacerbated in the West • NAAQS by itself can not drive adequate network design
National Nitrogen Observation Networks Also SEARCH, NPS SLAMS NADP CASTNET PM speciation NCORE
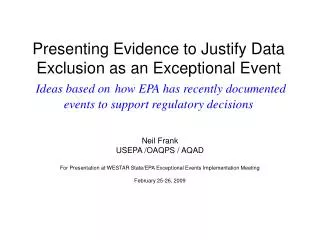
Existing and proposed sentinel sites – LRTAP 2007 assessment
What’s missing • 1st…what is adequate (relative terms) • Great NO network • wet and dry nitrate But, • Rural coverage in general…especially Western States • Virtually no true NO2 observations • Skeleton NOy network • Missing routine and sustained vertical profile and aloft data • Sentinel transport sites • Reliance on occasional intensive studies (2010 CALNEX)
Rethinking Nitrogen/ozone monitoring in rural/regional scales • Opportunities • NAAQS • New NO2 standard • Lead to molecule specific observations • N/S secondary standards review • Possible growth of NOy observations • Increased attention to NH3 • catalyze blending models and obs (spatial scarcity and wet-dry anomolies) • Tighter primary ozone standards & secondary ozone standard • Spread to regional/Western locations • Greater influence of hemispherical transport • Collaborations across agencies, remote sensing • Blending models and observations
Satellites provide best source of ambient NO2: Accountability and Trends Figure 20. Left - superimposed Eastern U.S. emission and combined GOME and SCIAMACHY NO2 1997-2002 trends (Kim et al., 2006); right - GOME NO2 trends from 1995 – 2002 (after Richter, 2005). Clear evidence of reductions in midwest U.S. and European NOx emissions, and increased NOx generated in Eastern Asia. Figure 21. 2004 OMI NO2 column images aggregated for all Fridays (left) and Sundays (right) indicating weekend/weekday patterns associated with reduced Sunday emissions (source, Husar).
Global Distribution of Nitrogen Dioxide: Precursors to Ozone Formation (Fishman) Tropospheric NO2 columns retrieved from the SCIAMACHY satellite instrument for 2004 –2005 (after Martin et al., 2002)
Overview of the GEO-CAPE Mission Geostationary Coastal and Air Pollution Events Mission Jack Fishman Science Directorate NASA Langley Research Center OH • Understanding the the Oxidizing Capacity (amount and distribution of OH) of the Troposphere and the Tropospheric Ozone Cycle Drives the Science • Species in Red Can be Observed by Satellite
Best Method to Observe Pollution is from Geostationary Orbit TOMS (Daily) 100-km res. Geostationary (Hourly) OMI (Daily) Map of Houston and surrounding area Technology Readily Available: O3, CO, NO2, SO2, CH2O and aerosols
Integrated Column NO2 Accurately Captures Diurnal Behavior Surface Concentrations and Integrated NO2 Column Calculated by CMAQ Plotted as a Function of Hour: June 22-23, 2005 Surface NO2 Concentrations Calculated by CMAQ Plotted as a Function of Hour: June 22-23, 2005 Measurements from GeoTRACE Capture Daylight Portion of Diurnal Cycle Surface NO2 Calculated by CMAQ (ppb) Column NO2 Calculated by CMAQ (1015 mol. cm-2) June 22 Hour of Day (GMT) June 23 Observations from GEO: NO2 Measurements Every 30-60 Minutes Throughout Sunlit Hours
Blending observations and models: Data Fusion (Rizzo/Baldridge) • Support for poorly monitored areas • e.g., Rural ozone characterization = Another Eastern U.S. HQ bias?
2001-2006 CDC PHASE ozone and PM2.5 surfaces (Kilaru) http://www.epa.gov/nerlesd1/land-sci/lcb/lcb_sads.html
Data/IT systems • A word about VIEWS/TSS • Collaboration with NASA ROSES CSU/CMAS, USDA and Bluesky Rains, GEOSS • Community cost sharing
Total column depth (through Satellites) AQ model results Vertical Profiles Land AQ Monitors Integrated Observation- Modeling Maximizing space/time/composition through systems integration • Integration of systems to improve • air quality models for forecast • Current and • Retrospective assessments • Global-Regional Air Quality Connections • Climate-AQ connections Optimized air chemistry Characterizations ecosystems accountability Air management Exposure/Health
Near-road NO2 Site Selection • Rank all road segments within a CBSA by Annual Average Daily Traffic (AADT) and then identifying a location or locations adjacent to those highest road segments where maximum hourly NO2 concentrations are expected to be highest • Additional factors to consider: proximity to interchanges, fleet mix (diesel vs. light-duty), rapidly accelerating traffic, grade-climbing traffic, local terrain and meteorological effects • Monitor probes must be no greater than 50 meters away, horizontally, from the outside nearest edge of the traffic lanes of the target road segment • Located within 2 to 7 meters above the ground; may be placed on the interior side of any noise barriers (not ideal, however) Beckerman et.al., 2008
Overview of Public Comments on NO2 • Current Standard • CASAC, environmental/public health groups, and most states agree with the proposed conclusion that the current standard alone is not requisite to protect public healthwith an adequate margin of safety • Some industry groups commented that revision of the current standard is not justified at this time based largely on uncertainties in the scientific evidence • Approach to setting a new 1-hour standard and establishing a 2-tiered monitoring network • CASAC, environmental/public health groups, and most states support the establishment of a new 1-hour standard and the need to obtain better information on NO2 concentrations around roads • Groups disagree regarding the most appropriate approach • Industry does not support the establishment of a new 1-hour standard or the proposed monitoring network based largely on uncertainties in the scientific evidence • Standard level and form • CASAC and some States support our proposed ranges of levels and recommend a 98thpercentile form under the proposed approach • Environmental/public health groups recommend a lower level with a more stringent form (e.g., 99th percentile or no exceedance) • Industry groups recommend a higher level and generally recommend a 98th percentile form
CASAC Comments on NO2 Approach • CASAC stronglysupports the establishment of a new 1-hour standard and the need to obtain better information on NO2 concentrations around roads • CASAC consensus was that we need to monitor near roads, but CASAC members were split regarding the most appropriate approach • The majority of CASAC membersfavor the proposed approach noting that this approach would be more effective than the alternative at limiting roadway-associated exposures • A minority of CASAC members favor the alternative approach, combinedwith the establishment of a research-oriented near-road network noting… • That epidemiologic studies did not use near-roadway exposure data • The limited information available at this time to inform the design of a national roadside monitoring network
Other Public Comments on NO2 • Most environmental and public health organizations strongly support the proposed NAAQS and near-road monitoring • Mixed response from State, Local, and tribal air monitoring groups and agencies. • Mostly support near-road monitoring, but are divided on: • 1) Specifics on monitor requirement triggers and siting, and • 2) Whether EPA should run a research network (non-regulatory) or an actual regulatory network
Anticipated NO2 Implementation Schedule Under a judicial consent decree, EPA must complete this review of the primary NO2 standard by January 22, 2010.
County-Level Ozone Design Value Maps based on 2006-2008 data 9/8/09 Contact David Mintz x5224 with questions
Counties with 2006-2008 8-hour Design Value Above 0.075 ppm Virgin Islands Alaska Hawaii Puerto Rico
Counties with 2006-2008 8-hour Design Value Above 0.070 ppm Virgin Islands Alaska Hawaii Puerto Rico
Counties with 2006-2008 8-hour Design Value Above 0.065 ppm Virgin Islands Alaska Hawaii Puerto Rico
Counties with 2006-2008 8-hour Design Value Above 0.060 ppm Virgin Islands Alaska Hawaii Puerto Rico
Counties with 2006-2008 W126 Value Above 21 ppm-hours Virgin Islands Alaska Hawaii Puerto Rico