Download
1 / 23
360 likes | 1.08k Vues
MTAT.03.231 Business Process Management (BPM) Lecture 5: Quantitative Process Analysis. Marlon Dumas marlon.dumas ät ut . ee. Business Process Analysis. Process Analysis Techniques. Profit maximizing firms. Non-profit organizations. Maximize long term shareholder value.

E N D
MTAT.03.231Business Process Management (BPM)Lecture 5: Quantitative Process Analysis Marlon Dumas marlon.dumas ät ut . ee
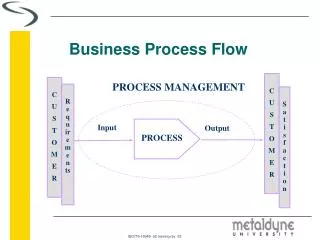
Profit maximizing firms Non-profit organizations Maximize long term shareholder value Survive and grow while satisfying customer needs Process Performance Measures • Link the identified processes to measurable objectives • Quantify the benefits of improvement Maximize revenues and minimize costs Use resources efficiently while satisfying customer needs Satisfy customer needs (effectiveness) in an efficient way (efficiency) Inspired by a slide by Manuel Laguna & John Marklund
Fill in the blanks If you had to choose between two services, you would typically choose the one that is: • F… • B… • C…
Let’s start with time Mark McGuinness: Time Management for Creative People
Cycle Time Analysis • Cycle time: Difference between a job’s start and end time • Cycle time analysis: the task of calculating the average cycle time for an entire process or process fragment • Assumes that the average activity times for all involved activities are available (activity time = waiting time + processing time) • In the simplest case a process consists of a sequence of activities on a sequential path • The average cycle time is the sum of the average activity times • … but in general we must be able to account for • Alternative paths (XOR splits) • Parallel paths (AND splits) • Rework (cycles)
CT = p1T1+p2T2+…+pnTn = Alternative Paths Inspired by a slide by Manuel Laguna & John Marklund
Alternative Paths – Example • What is the average cycle time?
CTparallel = Max{T1, T2,…, TM} Parallel Paths • If two activities related to the same job are done in parallel the contribution to the cycle time for the job is the maximum of the two activity times. Inspired by a slide by Manuel Laguna & John Marklund
Parallel Paths – Example • What is the average cycle time?
CT = T/(1-r) Rework • Many processes include control or inspection points where if the job does not meet certain standard, it is sent back for rework
Rework – Example • What is the average cycle time?
Rework At Most Once – Example • What is the average cycle time?
Quick exercise Calculate cycle time
Cycle Time Efficiency = Cycle Time Efficiency • Measured as the percentage of the total cycle time spent on value adding activities. • CT = cycle time as defined before • Theoretical Cycle Time (TCT) is the cycle time if we only counted value-adding activities and excluded any waiting time or handover time • Count only processing times Inspired by a slide by Manuel Laguna & John Marklund
Flow Analysis • The previous technique for cycle time analysis is only one example of what can be done using flow analysis techniques • Other applications: • Calculating cost-per-process-instance (cf. Textbook) • Calculating error rates at the process level • Estimating capacity requirements
Limitation 1: Not all Models are Structured 0.3 0.5 0.7 0.8 0.5 0.2
Limitation 2: Fixed load + fixed resource capacity • Cycle time analysis does not consider waiting times due to resource contention • Queuing analysis and simulation address these limitations and have a broader applicability
Cycle Time & Work-In-Progress • WIP = (average) Work-In-Process • Number of cases that are running (started but not yet completed) • E.g. # of active and unfilled orders in an order-to-cash process • WIP is a form of waste (cf. 7+1 sources of waste) • Little’s Formula: WIP = ·CT • = arrival rate (number of new cases per time unit) • CT = cycle time
Exercise A fast-food restaurant receives on average 1200 customers per day (between 10:00 and 22:00). During peak times (12:00-15:00 and 18:00-21:00), the restaurant receives around 900 customers in total, and 90 customers can be found in the restaurant (on average) at a given point in time. At non-peak times, the restaurant receives 300 customers in total, and 30 customers can be found in the restaurant (on average) at a given point in time. • What is the average time that a customer spends in the restaurant during peak times? • What is the average time that a customer spends in the restaurant during non-peak times?
Exercise (cont.) • The restaurant plans to launch a marketing campaign to attract more customers. However, the restaurant’s capacity is limited and becomes too full during peak times. What can the restaurant do to address this issue without investing in extending its building?
![IS 788 [Process] Change Management](https://cdn2.slideserve.com/3887590/is-788-process-change-management-dt.jpg)