Analysis Report of SN1006 by D. Nishida at JPS Meeting Autumn 2005, Osaka
70 likes | 188 Vues
This report presents the analysis of SN1006 based on the findings of D. Nishida from Kyoto University during the JPS meeting in Autumn 2005, held in Osaka. It includes detailed cut parameters and methodologies used in calculating intersection points relevant to the research. The likelihood ratios and effective time data provide insights, while the findings are contextualized with respect to the Crab integral flux and photon emission rates above 640 GeV. The results offer valuable information for future astrophysical studies and enhance understanding of SN1006.

Analysis Report of SN1006 by D. Nishida at JPS Meeting Autumn 2005, Osaka
E N D
Presentation Transcript
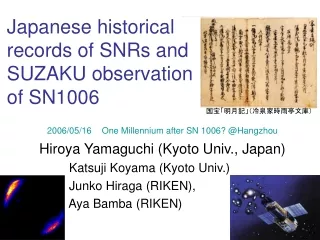
Analysis report of SN1006 D.Nishida( Kyoto-Univ.) JPS meeting Autumn 2005 Osaka
Cut parameters • -30 ns < TDC start < 30 ns • 5 p.e x T5a • Distance from camera center < 1.6 deg • Likelihood ratio > 0.7
Calculating intersection point (1) • x’ = (xa*sinA + xb*sinB + xc*sinC)/(sinA+sinB+sinC) • y’ = (ya*sinA + yb*sinB + yc*sinC)/(sinA+sinB+sinC) A (xa, ya) (xc, yc) B C (xb, yb)
Theta square distribution (1) • cross line: On data • red line: Off data • Effective time • 61089 sec(17h)
Calculating intersection point (2) • c2 = S (width(x,y)/swid )2
Theta square distribution (2) • Cross line : On data • Red line : Off data
Upper limit • Use calculating method No.2 • Line is Crab integral flax • F(E>640GeV) = 2.2 x 10⁻¹² photon/cm2/sec( ~5% Crab flux)