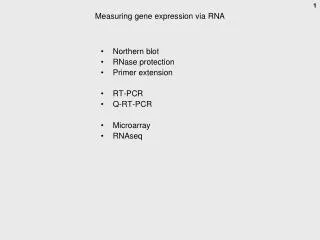
Measuring Gene Expression
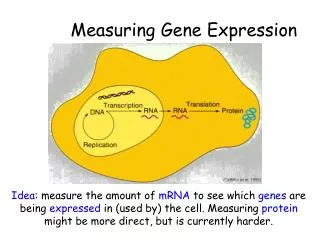
Measuring Gene Expression. Idea : measure the amount of mRNA to see which genes are being expressed in (used by) the cell. Measuring protein might be more direct, but is currently harder. Central Assumption of Gene Expression Microarrays.

Measuring Gene Expression
E N D
Presentation Transcript
Measuring Gene Expression Idea: measure the amount ofmRNAto see whichgenesare beingexpressedin (used by) the cell. Measuringproteinmight be more direct, but is currently harder.
Central Assumption of Gene Expression Microarrays • The level of a given mRNA is positively correlated with the expression of the associated protein. • Higher mRNA levels mean higher protein expression, lower mRNA means lower protein expression • Other factors: • Protein degradation, mRNA degradation, polyadenylation, codon preference, translation rates, alternative splicing, translation lag…
Principal Uses of Microarrays • Genome-scale gene expression analysis • Differential gene expression between two (or more) sample types • Responses to environmental factors • Disease processes (e.g. cancer) • Effects of drugs • Identification of genes associated with clinical outcomes (e.g. survival)
Biological question Differentially expressed genes Sample class prediction etc. Experimental design Microarray experiment Image analysis Normalization Estimation Testing Clustering Discrimination Biological verification and interpretation
Microarray example: Biomarker identification - lung cancer Samples Genes Garber, Troyanskaya et al. Diversity of gene expression in adenocarcinoma of the lung. PNAS 2001, 98(24):13784-9.
Data partitioning clinically important: Patient survival for lung cancer subgroups 1 Cum. Survival (Group 1) .8 Cum. Survival (Group 2) Cum. Survival (Group 3) .6 Cum. Survival .4 .2 0 0 10 20 30 40 50 60 Time (months) p = 0.002 for Gr. 1 vs. Gr. 3 Garber, Troyanskaya et al. Diversity of gene expression in adenocarcinoma of the lung. PNAS 2001, 98(24):13784-9.
Technology basics • Microarrays are composed of short, specific DNA sequences attached to a glass or silicon slide at high density • A microarray works by exploiting the ability of an mRNA molecule to bind specifically to, or hybridize, the DNA template from which it originated • RNA or DNA from the sample of interest is fluorescently-labeled so that relative or absolute abundances can be quantitatively measured
Two color vs single color Bakel and Holstege. 2007. http://www.cell-press.com/misc/page?page=ETBR
Other applications of microarray technology (besides measuring gene expression) • DNA copy number analysis • SNP analysis • chIP-chip (interaction data) • Competitive growth assays • …
Major technologies • cDNA probes (> 200 nt), usually produced by PCR, attached to either nylon or glass supports • Oligonucleotides (25-80 nt) attached to glass support • Oligonucleotides (25-30 nt) synthesized in situ on silica wafers (Affymetrix) • Probes attached to tagged beads
Probe selection Non-redundant set of probes Includes genes of interest to project Corresponds to physically available clones Chip layout Grouping of probes by function Correspondence between wells in microtiter plates and spots on the chip cDNA Microarray Design
Building the chip Ngai Lab arrayer , UC Berkeley Print-tip head
Probes are oligos synthesized in situ using a photolithographic approach Typically there are multiple oligos per cDNA, plus an equal number of negative controls The apparatus requires a fluidics station for hybridization and a special scanner Only a single fluorochrome is used per hybridization Affymetrix GeneChips
Affy There may be 5,000-100,000 probe sets per chip A probe set = 11-20 PM, MM pairs
Interpreting Affymetrix OutputPerfect Match/Mismatch Strategy Each probe designed to be perfectly complementary to a target sequence, a partner probe is generated that is identical except for a single base mismatch in its center. These probe pairs, called the Perfect Match probe (PM) and the Mismatch probe (MM), allow the quantitation and subtraction of signals caused by non-specific cross-hybridization. The difference in hybridization signals between the partners serve as indicators of specific target abundance