Ensemble Forecasting
Ensemble Forecasting. Brian Duddy. What is ensemble forecasting?. At its most basic level, ensemble forecasting is a method of using a mathematical model or models to predict the future behavior of a complex, dynamic system that cannot be predicted exactly

Ensemble Forecasting
E N D
Presentation Transcript
Ensemble Forecasting Brian Duddy
What is ensemble forecasting? • At its most basic level, ensemble forecasting is a method of using a mathematical model or models to predict the future behavior of a complex, dynamic system that cannot be predicted exactly • It is a form of the Monte Carlo method, in that inputs to a model are (to a point) randomly generated; it can also be compared to sensitivity testing • It is usually heard in relation to weather forecasting-most modern weather forecasts, including those on the news and from the National Weather Service, use some kind of ensemble forecasting, and it seen especially often in predicting the movement of hurricanes. It is also used in other fields, such as predicting the distribution of species of animals. • Ensemble forecasting can broadly refer to two different methods: predictions using a single model or predictions using multiple models
Why use ensemble forecasting? • Like all models, weather models are not perfect-a “perfect model” would need to account for the temperature, pressure, wind speed, etc. at every point and every elevation above the Earth’s surface, which is obviously not possible • The data used to make weather models is imperfect-there are instrument errors, weather stations are typically about 100 km apart (in the US), data for conditions over the oceans is sparse, and weather balloons (necessary for measuring atmospheric conditions) are in short supply • The weather is inherently chaotic, so it is almost impossible to make accurate predictions with a single run anyway • When attempting to make long-term predictions (anything past 2-3 days) which are, of course, demanded by a TV audience (and others), any initial error will be magnified until it destroys the ability of the model to provide any useful predictions
History • “Traditionally”, weather forecasting using models attempted to model the behavior of the atmosphere exactly. However, in 1965, MIT professor Ed Lorenz noted the three inherent sources of error in forecasting presented in the previous slide. Although models and data collection have gotten better since then, they are still not perfect (and never will be), and inherent chaos will always remain. • The first evidence that forecasts based on an “ensemble” of several different models was better than a single run was provided by Epstein (1969) and Leith (1974). • Different methods for creating ensemble forecasts were suggested throughout the 70s and 80s by various scientists. However, it was not until 1992 when systems for doing so became operational, at the National Centers for Environmental Prediction andEuropean Centre for Medium-Range Weather Forecasts. • Most major national weather centers now use some kind of ensemble forecasting. Also, several private companies have developed their own systems based on the principle and are selling them; for example, the picture seen here advertises a product called “Super Ensemble”-its prediction is shown in red, several others are in other colors, and the actual track of the hurricane in question is shown in black.
Ensemble forecasting using a single model • Ensemble forecasting using a single model (also known as multiple-initial condition, or multi-IC) involves creating slight deviations in the observed data (or in unobserved but necessary data, for example atmospheric temperature) • The model is run for each set of data to the desired time-then several approaches can be used. They can be averaged to form a single forecast, the “ensemble-mean”, or similar predictions can be averaged to form “cluster” forecasts. • Alternatively, the forecasts can be used to provide probabilities of certain events. For example, if 50% of the runs of the model showed rain occurring, it might be stated that there is a 50% chance of rain.
Ensemble forecasting using multiple models • This is broadly similar to the previous method, but instead of using just one model, multiple models are used; the models can be ensembles themselves, or they can be strictly deterministic and use the best possible data • This is often seen with predicting the path of a hurricane; in this case, every area that falls close to one of the predicted paths is considered a “danger zone”
Example • This map shows various models predicting the path of Hurricane Ike shortly before it made landfall This is the combined National Hurricane Center forecast, with the white zone representing the “potential track area” A note from the NHC accompanied their forecast: IT CANNOT BE REPEATED ENOUGH THAT FOUR- AND FIVE-DAY TRACK FORECASTS CAN HAVE SIGNIFICANT ERRORS…AND COMBINED WITH THE FACT THAT THE MODEL SPREAD IS STILL NOTABLE BEYOND 72 HOURS…ONE SHOULD NOT FOCUS ON THE EXACT TRACK.
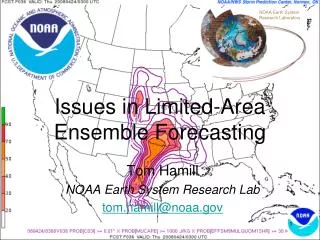
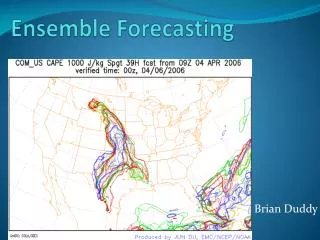
Title slide revisited This is an NOAA forecast from midnight, Apr. 6 2006 of convective available potential energy (CAPE), which measures the potential for large thunderstorms to occur. Each different model run, or “ensemble member”, uses a different color. Each model outlines an area at which the CAPE is above 1000 J/kg, a threshold above which large storms are likely to occur. The more bands a specific area is inside, the more likely it is (according the the models) that the CAPE will be above the threshold. Thus Oklahoma, Kansas, and northwestern Texas are predicted to have a large CAFÉ, while Louisiana and Arkansas have a lower predicted probability (of course, the West and East are predicted to have essentially no probability of such a CAPE value)
Tomorrow’s weather(messages between NWS meterologists) We now have the two key components to the potential winter storm for Wednesday and Wednesday night over land in order to begin to get better sampling. As a result...we have seen a shift nwwd to the expected storm track as well as a timing adjustment to have the storm move in a bit quicker than previous model runs. This has occurred on all models...but there still remains a decent spread in storm tracks although the timing is roughly the same. The GFS(1) has been the most southerly track with this storm almost since it began tracking it several days ago. The NAM(2) has been the most northerly since the storm timing moved within 84hrs. The most consistent model run-to-run has been the Canadian Gem(3). This has consistently advertised a track through the middle of the forecast area and will be largely what this forecast is based off of...at least with the synoptic scale features. And it isn/T(sp) much surprise that the most consistent model now lies squarely in the middle of the 12z model spread. After the models were a bit hesitant to build in the cold air a few days ago...they have all come on board with the idea that the cold front will move through Wednesday morning and early afternoon and will be followed by strong cold air advection at the boundary layer and cooling through the column due to evaporational cooling. These two factors have led to an increasing model certainty on an earlier transition from rain to snow...for KUIN-kcou(4) during early Wednesday afternoon...for kstl-kfam(5) during late Wednesday afternoon...and for kslo during early Wednesday evening. Have taken a more aggressive approach on probability of precipitation than the previous forecast to acknowledge the model shift and a bit more increased confidence on track...but exact precipitation changeover timing is tricky and so snow forecast amounts are not a complete committment to the changeover timing until we see some consistency in this area. • 1: Global Forecasting System, run by NOAA • 2: North American Mesoscale, run by National Weather Association • 3: Global EnviromentalMultiscale • 4: Baldwin/Columbia • 5: Lambert Airport/Farmington • 6: Salem (IL) (As of 9:30 PM on Monday, when these were the most recent messages, there is a 60% chance of snow tomorrow)
References • http://www.nssl.noaa.gov/divisions/forecast/mat/ensemble.php (opening picture and associated information) • http://en.wikipedia.org/wiki/Ensemble_forecasting (background, general information) • http://www.wunderground.com/tropical/ (inspiration-during times of hurricane activity, they provide views of several different hurricane path models) • http://www-das.uwyo.edu/~geerts/cwx/notes/chap13/ensemble.html (traditional sources of error) • http://a11news.com/625/hurricane-ike-computer-model/ (images) • http://www.springerlink.com/content/x40451323776q710/fulltext.pdf?page=1 (some historical info) • http://www.atmos.umd.edu/~ekalnay/50NWPKalnay2cols.pdf (history) • http://www.weatherpredict.com/industry-research/super-ensemble.html (example of a product based on this principle) • http://www.wunderground.com/cgi-bin/findweather/getForecast?query=63105&wuSelect=WEATHER (tomorrow’s weather/meterologist messages)